. 2025 Jul 3;23(7):e3003265.
doi: 10.1371/journal.pbio.3003265. eCollection 2025 Jul.

Plasma membrane remodeling in GM2 gangliosidoses drives synaptic dysfunction

Affiliations

Plasma membrane remodeling in GM2 gangliosidoses drives synaptic dysfunction

Alex S Nicholson et al. PLoS Biol. .

Abstract

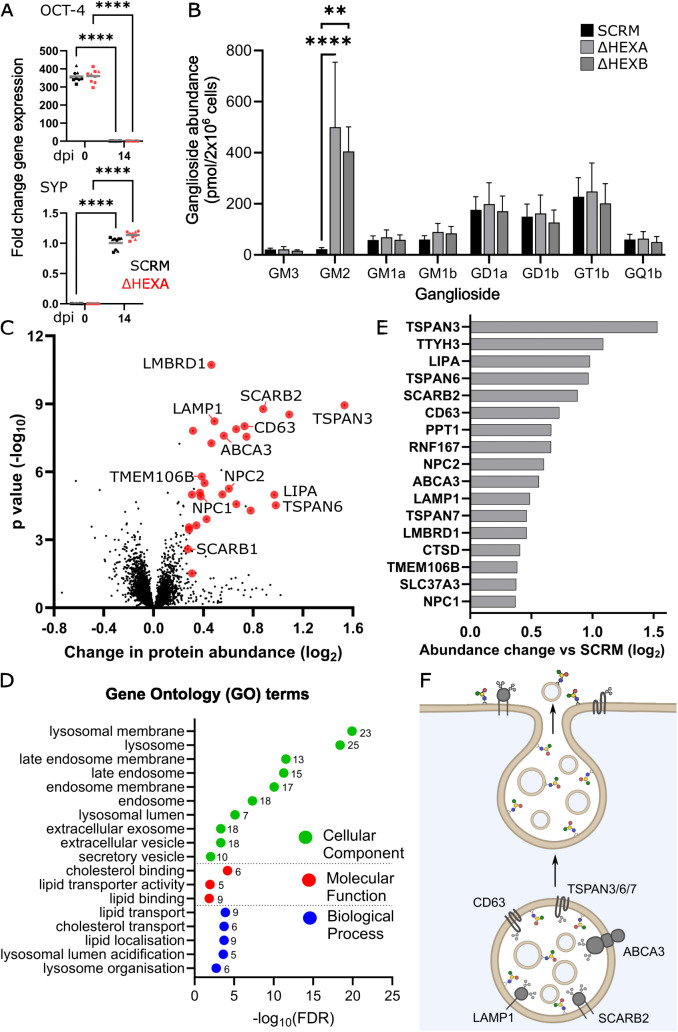
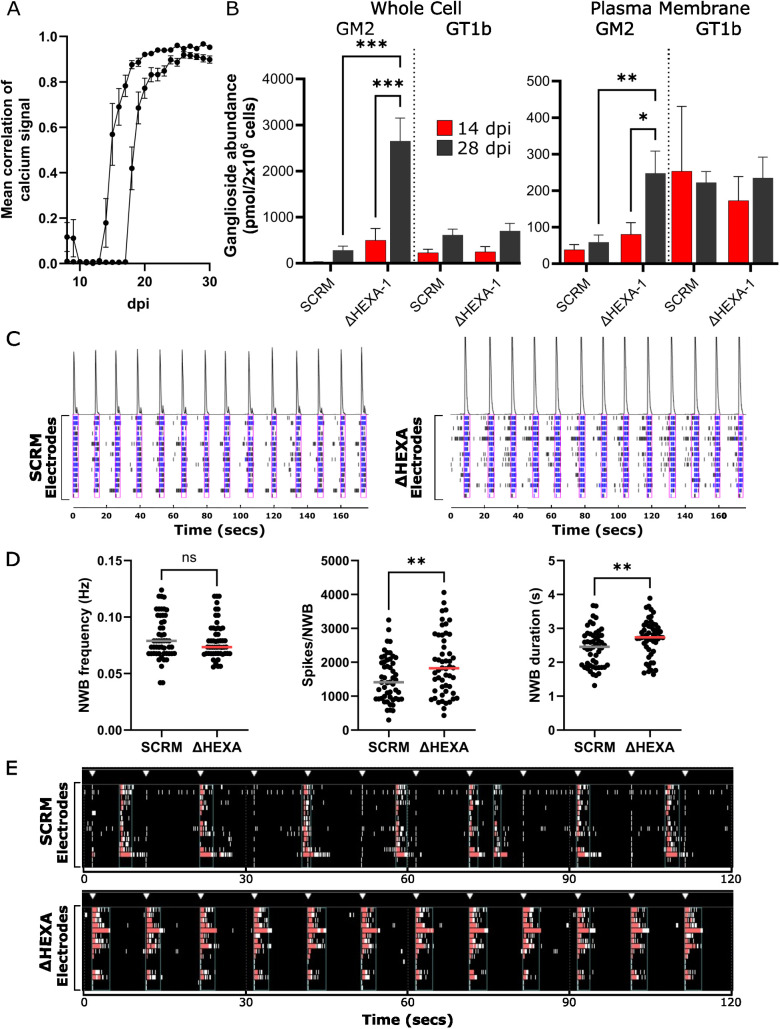
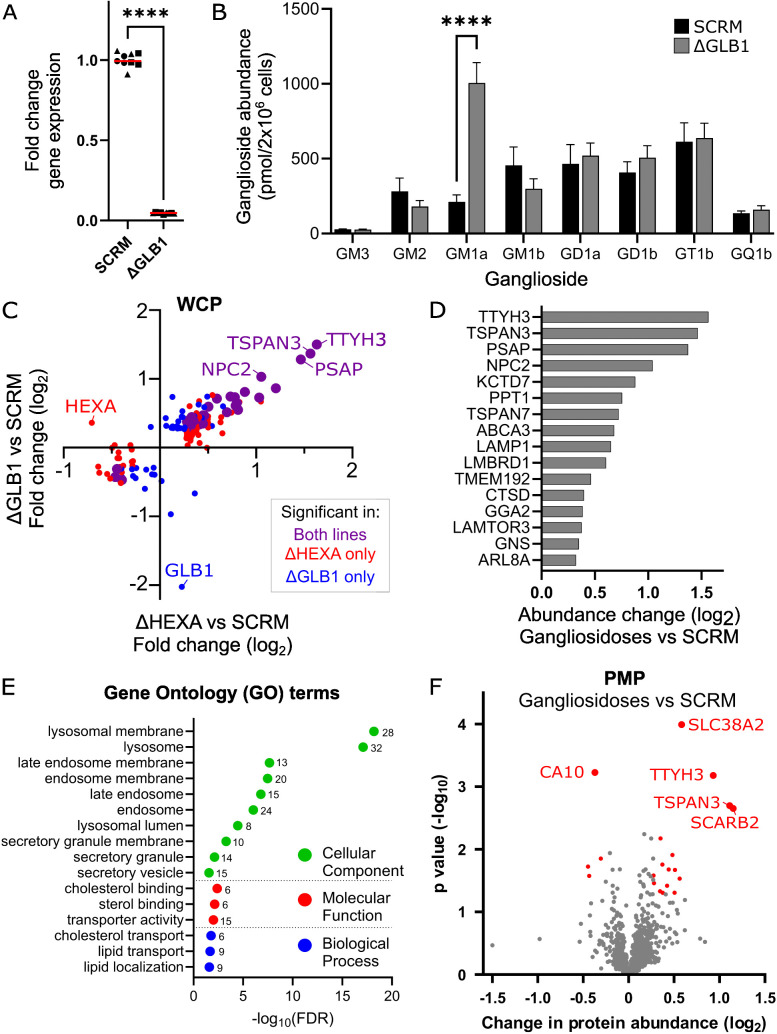
Glycosphingolipids (GSL) are important bioactive membrane components. GSLs containing sialic acids, known as gangliosides, are highly abundant in the brain and diseases of ganglioside metabolism cause severe early-onset neurodegeneration. The ganglioside GM2 is processed by β-hexosaminidase A and when non-functional GM2 accumulates causing Tay-Sachs and Sandhoff diseases. We have developed i3Neuron-based disease models demonstrating storage of GM2 and severe endolysosomal dysfunction. Additionally, the plasma membrane (PM) is significantly altered in its lipid and protein composition. These changes are driven in part by lysosomal exocytosis causing inappropriate accumulation of lysosomal proteins on the cell surface. There are also significant changes in synaptic protein abundances with direct functional impact on neuronal activity. Lysosomal proteins are also enriched at the PM in GM1 gangliosidosis supporting that lysosomal exocytosis is a conserved mechanism of PM proteome change in these diseases. This work provides mechanistic insights into neuronal dysfunction in gangliosidoses highlighting that these are severe PM disorders with implications for other lysosomal and neurodegenerative diseases.


Conflict of interest statement

The authors have declared that no competing interests exist.

Figures

Fig 1
Fig 1. Neuronal i3N models of Tay–Sachs and Sandhoff diseases.
A. Schematic diagram of the GM2 ganglioside detailing the composition of the glycan headgroup and illustrating which bond is cleaved by the HexA enzyme (red dotted line). B. Schematic diagram of how the α- and β-subunits can form homo- and heterodimers with the HexA heterodimeric isoenzyme being the only one that can cleave GM2. GM2 is presented to HexA by the GM2 activator protein (GM2ap). C. Quantitative PCR (qPCR) analysis of HEXA and HEXB gene expression in neurons following CRISPRi-induced knockdown. Fold change relative to SCRM controls are shown for each cell line, N = 3 biological replicates (squares, triangles, circles) were carried out in technical triplicate n = 3 and the mean is displayed (red line). Statistical significance was determined with a one-way ANOVA, ****p ≤ 0.0001. D. Activity assays from cell lysates of SCRM and HEXA and HEXB CRISPRi cell lines. Activity was determined using standard fluorescent substrates: MUGS is used for the detection of HexA isoenzyme; and MUG is cleaved by both HexA and HexB isoenzymes. The mean is displayed ± SEM, N = 3 biological replicates were carried out and significance was calculated using a one-way ANOVA test, ****p ≤ 0.0001. E. Fluorescence microscopy images of neurons stained for β3-tubulin (white), LAMP1 for lysosomes (red), GM2 (green) and DAPI (blue). GM2 positive puncta were quantified and analyzed for co-localization with lysosomes. Scale bar (white line) represents 20 μm. Forty-five images were analyzed per cell line across N = 3 biological replicates, significance was determined by two-way ANOVA, *p ≤ 0.05, **p ≤ 0.01, ****p ≤ 0.0001. F. Transmission electron microscopy images of SCRM, ΔHEXA and ΔHEXB CRISPRi cell lines. Zoomed images are shown to illustrate membrane whorls and zebra bodies in enlarged lysosomes. Scale bar (white line) represents 500 nm. Twenty images were analyzed per cell line across n = 5 EM grids. Only endolysosomes where the entire compartment was visible were quantified. Significance was calculated using a Kruskal–Wallis test, ****p ≤ 0.0001. Underlying data used to generate these figures are available in S1 Data at https://doi.org/10.17863/CAM.118836.
Fig 2
Fig 2. Neuronal maturation, GM2 quantification and the impact of GM2 accumulation on the whole cell proteome of Tay–Sachs and Sandhoff disease models.
A. qPCR analysis of gene expression for the stem cell marker OCT-4 and the neuronal marker synaptophysin (SYP) in SCRM and ΔHEXA-1 cell lines at 0 and 14 dpi. Fold change is calculated relative to 14 dpi SCRM controls, N = 3 biological replicates were carried out in technical triplicate n = 3 (squares, triangles, circles) and the mean is displayed (grey line). Significance was determined with a two-way ANOVA, ****p ≤ 0.0001. B. Quantification of whole-cell gangliosides at 14 dpi for SCRM, ΔHEXA and ΔHEXB cell lines, the mean of N = 3 biological replicates is displayed ± SEM. Significance was determined by two-way ANOVA, **p ≤ 0.01, ****p ≤ 0.0001. C. Quantitative whole cell proteomics (WCP) data for ΔHEXA-1/2 and ΔHEXB-1/2 neurons compared with the SCRM control. A volcano plot is shown with average fold change (x-axis) across N = 3 biological replicates and significance (y-axis, two-sided t test) across the three replicates. Endolysosomal proteins are colored in red with targets mentioned in the text labelled. D. Gene ontology (GO) term analysis for proteins significantly changed in the WCP dataset. Changes are shown for cellular component, molecular function and biological process with the change plotted as the false discovery rate (log10FDR) and the number of proteins in each group indicated. E. Select targets from the WCP are represented graphically to illustrate the fold change in whole cell protein abundance in ΔHEXA and ΔHEXB neurons vs. SCRM neurons. F. Schematic diagram of lysosomal exocytosis and how this process can contribute to changes in lipid and protein abundance at the plasma membrane (PM). A selection of lysosomal proteins increased in abundance in the WCP of ΔHEXA and ΔHEXB neurons are illustrated. Underlying data used to generate these figures are available in S1 Data at https://doi.org/10.17863/CAM.118836.
Fig 3
Fig 3. Molecular consequences of GM2 accumulation on the protein composition of the plasma membrane (PM).
A. Quantitative mass spectrometry following enrichment of PM proteins from ΔHEXA and ΔHEXB neurons compared with the SCRM control. A volcano plot is shown with average fold change (x-axis) across three biological replicates and significance (y-axis, two-sided t test) across the three replicates. Targets colored in blue are synaptic proteins and in red are lysosomal proteins with selected targets labelled. B. Select targets are represented graphically to illustrate the fold change in PM protein abundance in ΔHEXA and ΔHEXB neurons vs. SCRM neurons. C. Illustration of proteins with increased abundance at the PM in ΔHEXA and ΔHEXB neurons, compared to SCRM neurons, that play important roles in neuronal signalling such as synaptic vesicle recycling and synaptic adhesion and receptor molecules. Underlying data used to generate these figures are available in S1 Data at https://doi.org/10.17863/CAM.118836.
Fig 4
Fig 4. Increased spontaneous and stimulated neuronal network activity in ΔHEXA neurons compared with SCRM neurons.
A. Calcium signalling was monitored over 30 dpi for SCRM, ΔHEXA and ΔHEXB cell lines. Calcium signalling of cells starts to become synchronous (measured as correlation of bursting objects) from about 15 dpi with increasing signal correlation over time. Four technical repeats, n = 4 of N = 2 independent experiments are shown with data from all cell lines (mean of SCRM, ΔHEXA and ΔHEXB ± SEM) combined to demonstrate that within an experiment, all cell lines are well correlated but between experiments, time to 100% correlation can differ until about 25 dpi. B. Quantification of gangliosides GM2 and GT1b from whole cell (left) and PM-enriched (right) samples of neurons at 14 and 28 dpi for N = 3 biological replicates of SCRM and ΔHEXA cells. Significance was determined by two-way ANOVA, *p ≤ 0.05, **p ≤ 0.01, ***p ≤ 0.001. C. Representative activity traces (raster plots) of spontaneous neural activity for SCRM (left) and ΔHEXA (right) neurons. Activity is recorded over time on each of the 15 electrodes with spikes (black), bursts (blue) and network bursts (pink boxes) shown over the same 180 s time period. The intensity of network activity is represented as a peak (above). D. Analysis of neuronal activity including network burst (NWB) frequency, number of spikes per NWB and NWB duration for data collected from N = 3 biological replicates across n = 52 wells over a time window from 38 to 45 dpi. Mean is displayed for SCRM (grey line) and HEXA (red line) and significance was determined with an unpaired t test, **p ≤ 0.01. E. Representative activity traces (raster plots) for SCRM (upper) and ΔHEXA (lower) neurons in response to repetitive field stimulation (white triangles). Activity over time is recorded on each of the 15 electrodes. Network bursts (red) are shown over the same 120 s time period. Underlying data used to generate these figures are available in S1 Data at https://doi.org/10.17863/CAM.118836.
Fig 5
Fig 5. A model of GM1 Gangliosidosis shares lysosomal proteomic changes and hallmarks of lysosomal exocytosis.
A. Quantitative PCR (qPCR) analysis of GLB1 gene expression in neurons following CRISPRi-induced knockdown at 14 dpi. Fold change relative to SCRM controls are shown for N = 3 biological replicates carried out in technical triplicate n = 3 (squares, triangles, circles) and the mean is displayed (red line). Significance was determined with an unpaired t test, ****p ≤ 0.0001. B. Quantification of whole-cell gangliosides at 28 dpi for SCRM, ΔGLB1 cells, the mean of N = 3 biological replicates is displayed ± SEM. Significance was determined by two-way ANOVA, ****p ≤ 0.0001. C. Analysis of quantitative WCP data at 28 dpi for ΔHEXA neurons compared with SCRM cells vs. ΔGLB1 neurons compared with SCRM cells. Fold change in protein abundance for ΔHEXA cells (x-axis) are plotted against fold change in protein abundance for ΔGLB1 cells (y-axis). Significance (2-sided t test across N = 3 biological replicates) is illustrated as those significantly changed in ΔGLB1 only (blue), ΔHEXA only (red) or in both (purple, large data points). D. Select shared targets from the WCP when both gangliosidosis models are combined are represented graphically to illustrate the fold change in whole cell protein abundance. E. GO term analysis for proteins significantly changed in the WCP for both gangliosidosis models is shown for cellular component, molecular function and biological process with the change plotted as the false discovery rate (log10FDR) and the number of proteins in each group indicated. F. Quantitative mass spectrometry following enrichment of PM proteins from ΔHEXA and ΔGLB1 gangliosidosis models compared with the SCRM control. A volcano plot is shown with average fold change (x-axis) and significance (y-axis, two-sided t test) across N = 3 biological replicates for each of the ΔHEXA and ΔGLB1 lines compared to N = 2 SCRM. Proteins that are significantly changed (p ≤ 0.05) are colored (red). Underlying data used to generate these figures are available in S1 Data at https://doi.org/10.17863/CAM.118836.

Similar articles

References

    1. Hannun YA, Obeid LM. Sphingolipids and their metabolism in physiology and disease. Nat Rev Mol Cell Biol. 2018;19(3):175–91. doi: 10.1038/nrm.2017.107 . - DOI - PMC - PubMed
    1. Kuo A, Hla T. Regulation of cellular and systemic sphingolipid homeostasis. Nat Rev Mol Cell Biol. 2024;25(10):802–21. doi: 10.1038/s41580-024-00742-y . - DOI - PMC - PubMed
    1. Sipione S, Monyror J, Galleguillos D, Steinberg N, Kadam V. Gangliosides in the brain: physiology, pathophysiology and therapeutic applications. Front Neurosci. 2020;14:572965. doi: 10.3389/fnins.2020.572965 . - DOI - PMC - PubMed
    1. Li C, Quintana Perez Y, Lamaze C, Blouin CM. Lipid nanodomains and receptor signaling: from actin-based organization to membrane mechanics. Curr Opin Cell Biol. 2024;86:102308. doi: 10.1016/j.ceb.2023.102308 . - DOI - PubMed
    1. Egawa J, Pearn ML, Lemkuil BP, Patel PM, Head BP. Membrane lipid rafts and neurobiology: age-related changes in membrane lipids and loss of neuronal function. J Physiol. 2016;594(16):4565–79. doi: 10.1113/JP270590 . - DOI - PMC - PubMed

LinkOut - more resources