Clinical Trial
. 2025 Jul 15;6(7):102215.
doi: 10.1016/j.xcrm.2025.102215. Epub 2025 Jul 2.

Epigenetic profiling identifies markers of endocrine resistance and therapeutic options for metastatic castration-resistant prostate cancer

Affiliations
Clinical Trial

Epigenetic profiling identifies markers of endocrine resistance and therapeutic options for metastatic castration-resistant prostate cancer

Tesa M Severson et al. Cell Rep Med. .

Abstract

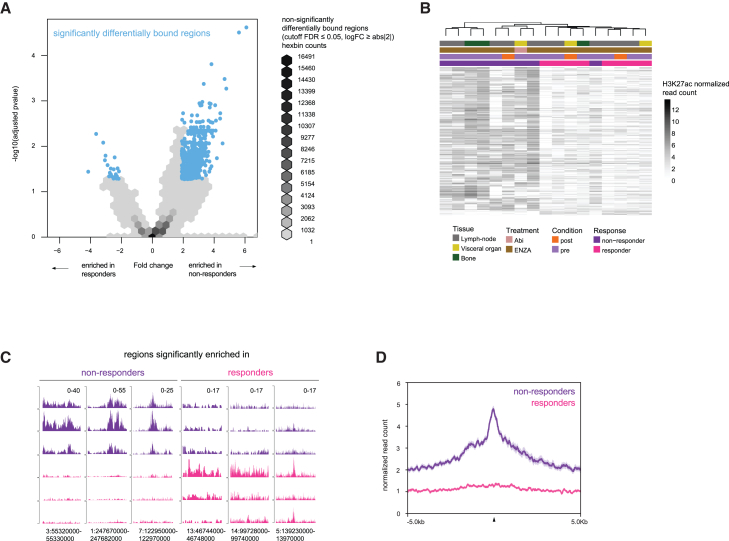
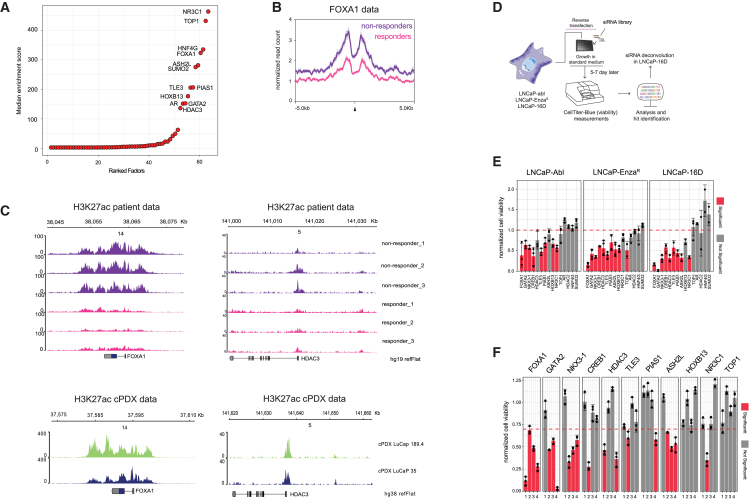
Androgen receptor (AR) signaling inhibitors, including enzalutamide, are treatment options for patients with metastatic castration-resistant prostate cancer (mCRPC), but resistance inevitably develops. Using metastatic samples from a prospective phase 2 clinical trial, we epigenetically profile enhancer/promoter activities with acetylation of lysine residue 27 on histone 3 (H3K27ac) chromatin immunoprecipitation followed by sequencing, before and after AR-targeted therapy. We identify a distinct subset of H3K27ac-differentially marked regions that are associated with treatment responsiveness, which we successfully validate in mCRPC patient-derived xenograft (PDX) models. In silico analyses reveal histone deacetylase (HDAC)3 to critically drive resistance to hormonal interventions, which we validate in vitro. Critically, we identify the pan-HDAC inhibitor vorinostat to be effective in decreasing tumor cell proliferation, both in vitro and in vivo. Moreover, we uncover evidence for HDAC3 working together with glucocorticoid receptor (GR) as a potential mechanism for this therapeutic effect. These findings demonstrate the rationale for therapeutic strategies including HDAC inhibitors to improve patient outcome in advanced stages of mCRPC.

Keywords: H3K27ac; HDAC inhibitors; androgen receptor; biomarkers; drug resistance; enzalutamide; epigenetics; hormone intervention; mCRPC; prostate cancer.


Conflict of interest statement

Declaration of interests W.Z. and A.M.B. received research funding from Astellas Pharma for the work performed in this manuscript. P.S.N. has served as a paid consultant to AstraZeneca, Janssen, Pfizer, and Genentech and received research support from Janssen for work unrelated to the present study.

Figures

None
Graphical abstract
Figure 1
Figure 1
Clinical trial design and ChIP-seq data collection (A) Setup of the clinical trial. Patients with mCRPC are enrolled in the study, and an imaging-guided biopsy is taken prior to onset of ENZA treatment. One patient in the study was treated with abiraterone. (B) Correlation heatmap of ChIP-seq data (50 kb bins across the genome, Pearson correlation) for H3K27ac, AR, and FOXA1 among all mCRPC samples (n = 40). Colors bars indicate ChIP factors: AR (light blue), FOXA1 (light green), and H3K27ac (dark green); tissue of sample origin: lymph node (gray), visceral organ (yellow), and bone (dark green); treatment: abiraterone (Abi, salmon) and enzalutamide (ENZA, brown); condition of the sample: pre-treatment (purple) and post-treatment (orange); and treatment response: non-responder (dark purple), responder (pink), intermediate (blue), and unknown (black outline). Scale bar indicates low (blue) to high correlation (red). (C) Snapshot of H3K27ac ChIP-seq (biological replicates, n = 28) in different treatment response groups: responders (pink), non-responders (purple), unknown (unk., black outline), and intermediate (blue). The read counts (left) and genomic coordinates (bottom) are indicated. (D) Principal component analysis using normalized read counts in all peaks in H3K27ac ChIP-seq data (n = 73039) from all samples (biological replicates, n = 28). Samples labeled according to responders (pink), non-responders (purple), intermediate (blue), or unknown (white). See also Figure S1; Tables S1 and S2.
Figure 2
Figure 2
Distinct H3K27ac profiles stratify patients with mCRPC on response to AR inhibition (A) Differentially enriched regions from H3K27ac ChIP-seq data visualized by volcano plot (n = 73,039). Regions marked by blue dots were significant (DiffBind DESeq2 two-tailed FDR-adjusted p value ≤ 0.05, log2FC ≥ abs|2|) (n = 848); all other regions are shown with hexbin density to avoid over-plotting (n = 72191). Each data point density tile (hexagon) represents the density of data within the tile from low (light gray) to high (black). (B) Heatmap showing normalized read count of H3K27ac data in significantly differentially bound regions (DiffBind DESeq2 two-tailed FDR-adjusted p value ≤ 0.05, log2FC ≥ abs|2|) (n = 848) in responder (n = 8) and non-responder samples (n = 9), biological replicates. Colors bars indicate tissue of sample origin: lymph node (gray), visceral organ (yellow), and bone (dark green); treatment: abiraterone (Abi, salmon) and enzalutamide (ENZA, brown); condition of the sample: pre-treatment (purple) and post-treatment (orange); and treatment response: non-responder (dark purple) and responder (pink). Scale bar indicates low (white) to high (black) normalized read counts. (C) Individual snapshot of H3K27ac enriched differently in 3 responder patients (pink) and 3 non-responder patients (purple) as examples (biological replicates). The read counts and genomic coordinates are indicated (top right and bottom, respectively). (D) Average normalized H3K27ac read count profiles of all merged data for responder patients (pink, n = 8) and all merged non-responder patients (purple, n = 9) at the 657 non-responder enriched sites (±5 kb from the peak center). Shading indicates standard error of the data. See also Figure S1; Table S2.
Figure 3
Figure 3
mCRPC PDX, PDX-derived cell line, and scRNA-seq validations of resistance-associated H2K27ac regions (A) Overview of the PDX models setup. Prostate cancer samples from patients with mCRPC were obtained and implanted into the mouse to establish PDXs. These PDXs were characterized previously with their response to castration by the change of tumor volume. (B) Heatmap depicting raw read counts of H3K27ac ChIP-seq signal from PDX samples at the non-responder-enriched 657 H3K27ac regions, identified from the mCRPC patient samples (±5 kb from the peak center). Scale bar indicates low (white) to high (black) read counts. (C) Average normalized H3K27ac read count profiles of all PDX merged data for samples with weak (gray, n = 8) and strong (black, n = 7) signal in the non-responder 657 H3K27ac regions (±5 kb from the peak center), biological replicates. Shading indicates standard error of the data. (D) Boxplots depicting doubling time of PDX models estimated using exponential (Malthusian) growth model (y axis) by group (x axis). The central mark indicates the median, and the bottom and top edges of the box indicate the 25th and 75th percentiles, respectively. The maximum whisker lengths are specified as 1.5 times the interquartile range. All individual values are depicted as circles colored by PDX model (strong H3K27ac – castration: n = 57, strong H3K27ac – control: n = 45, weak H3K27ac – castration: n = 71, weak H3K27ac – control: n = 73, biological replicates). Table below indicates the p values obtained for one-way ANOVA followed by Tukey honest significant difference (HSD) test for all combinations. (E) (Left) Average normalized H3K27ac read count profiles of all cPDX cell line merged data for non-responder classed sample, cPDX LuCaP 189.4 (green, n = 3) and responder classed sample, cPDX LuCaP 35 (dark blue, n = 3) signal in the non-responder 657 H3K27ac regions (±5 kb from the peak center), biological replicates. Shading indicates standard error of the data. (Middle) Same as above with AR data. (Right) Same as above with FOXA1 data. (Far right) Western blot of AR, FOXA1, H3K27ac, and HSP90 (control) for cPDX LuCaP 35 and cPDX LuCaP 189.4. Shading indicates standard error of the data. (F) Polar plot reporting the −10 × log10(p values) (Fisher’s exact test) of gene overlap enrichment tests between genes associated with H3K27ac non-responder regions and LNCaP scRNA-seq cluster marker genes. Color indicates strength of significance from low (pink) to high (red). (G) Uniform manifold approximation and projection (UMAP) visualization showing the average gene expression score of genes associated with H3K27ac non-responder regions in the parental LNCaP (left) and the ENZA-resistant, RES-B (right) single cells. Original scRNA-seq clusters (0–12) are superimposed on each plot. Scale bar indicates average expression score from low (gray) to high (red). See also Figure S2; Table S2.
Figure 4
Figure 4
Characterization of the non-responder-enriched H3K27ac sites reveals drivers of resistance (A) Enrichment analysis to determine significant overlap of 657 H3K27ac non-responder sites with publicly available ChIP-seq data for factors previously studied in prostate cancer cell lines (n = 863). Graph shows median enrichment score for each factor (GIGGLE combo score, indicating low to high significant enrichment score [Fisher’s exact two-tailed test and odds ratio]). Factors are ordered by highest score (enrichment) in the dataset with text shown in those with median enrichment score >100. (B) Average normalized FOXA1 read count profiles of merged data, at the 657 non-responder-enriched H3K27ac sites (±5 kb from the peak center), comparing patient samples, responders (pink, n = 8), and non-responders (purple, n = 9), biological replicates. Shading indicates standard error of the data. (C) (Left, top) Snapshot of H3K27ac ChIP-seq (3 chosen at random for each class) in different treatment response groups: responders (pink), non-responders (purple) at the FOXA1 locus. The read counts (left) and genomic coordinates (top) are indicated. (Left, bottom) Snapshot of H3K27ac ChIP-seq (one chosen at random for each class) in different treatment response groups from cPDX LuCaPs: responder (dark blue), non-responder (green) at the FOXA1 locus. The read counts (left) and genomic coordinates (top) are indicated. (Right, top) Same as left but for HDAC3 locus. (Right, bottom) Same as left but for HDAC3 locus. (D) Setup of siRNA screen to identify factors critical of prostate cancer cell line viability, resistant to androgen ablation or ENZA treatment. (E) Screen results for pooled siRNAs, showing decreased viability of prostate cancer cell line models LNCaP-Abl (left), LNCaP-EnzR (middle), and LNCaP-16D (right). Cell viability was determined by CellTiter-Blue, and data are normalized over siControl. Bars indicate mean values ±SD (n ≥ 2, technical replicates). Adjusted p values were determined by two-sided t test with multiple testing correction (Benjamini-Hochberg method). Statistically significant conditions (adjusted p value < 0.05) are shown in red. (F) siRNA deconvolution experiment, separately analyzing each individual siRNA for the 11 remaining hits in LNCaP-16D cells on cell viability. Cell viability was determined by CellTiter-Blue, and data are normalized over siControl. Bars indicate mean values ±SD (n ≥ 3, technical replicates). Adjusted p values determined as above. Statistically significant conditions (Benjamini-Hochberg adjusted p values < 0.05) are shown in red. See also Figures S3 and S4; Table S3.
Figure 5
Figure 5
Treatment effect and mechanistic insight in non-responder cPDX (A) Setup of analysis performed on patient-derived xenograft material, explants, (left) and in vitro and in vivo experiments (right) performed on cell lines derived from PDX (cPDX). (B) Incucyte cell proliferation analyses, in response to treatment in non-responder model cPDX LuCaP 189.4 (x axis is time in hours, y axis is percent confluence [shading: ± standard error of the mean]). Lines represent cell confluence in vehicle (purple), vorinostat (pink), ENZA (green), and combination of vorinostat and ENZA (turquoise), each treatment type: biological triplicates with 6 technical replicates. (C) In vivo mouse intervention experiments, showing smoothed tumor volume over time in mice injected with non-responder cPDX LuCaP 189.4 model cells (x axis time in treatment days, y axis tumor volume in cubic mm [shading: standard error of smoothed data]). After tumor outgrowth to 100 mm3, mice were treated daily with vehicle (purple, n = 10), vorinostat (pink, n = 10), ENZA (green, n = 10), and combination of vorinostat and ENZA (turquoise, n = 9), biological replicates). (D) Average ChIPseqSpikeInFree normalized H3K27ac read count profiles of merged data from cPDX LuCaP 189.4, at the 657 non-responder-enriched H3K27ac sites (±5 kb from the peak center) comparing FBS (dark blue), dexamethasone + DMSO (light green), dexamethasone + vorinostat (orange), and vorinostat alone (pink) (n = 3 biological replicates each). Shading indicates standard error of the data. (E) (Left) Average normalized GR read count profiles of merged data from cPDX LuCaP 189.4, at the 657 non-responder-enriched H3K27ac sites (±5 kb from the peak center) comparing dexamethasone (Dexa) + DMSO (light blue) and Dexa + vorinostat (gold) (n = 3 replicates each). (Right) Average GR read count profiles of merged data from cPDX LuCaP 189.4, TSS sites found within 50 kb of a 657 non-responder-enriched H3K27ac site (±5 kb from the peak center) comparing Dexa + DMSO (light blue) and Dexa + vorinostat (gold) (n = 3 biological replicates each). Shading indicates standard error of the data. See also Figure S5; Table S3.

Update of

Similar articles

References

    1. Bray F., Laversanne M., Sung H., Ferlay J., Siegel R.L., Soerjomataram I., Jemal A. Global cancer statistics 2022: GLOBOCAN estimates of incidence and mortality worldwide for 36 cancers in 185 countries. CA Cancer J. Clin. 2024;74:229–263. doi: 10.3322/caac.21834. - DOI - PubMed
    1. Mottet N., van den Bergh R.C.N., Briers E., Van den Broeck T., Cumberbatch M.G., De Santis M., Fanti S., Fossati N., Gandaglia G., Gillessen S., et al. EAU-EANM-ESTRO-ESUR-SIOG Guidelines on Prostate Cancer-2020 Update. Part 1: Screening, Diagnosis, and Local Treatment with Curative Intent. Eur. Urol. 2021;79:243–262. doi: 10.1016/j.eururo.2020.09.042. - DOI - PubMed
    1. Freedland S.J., Humphreys E.B., Mangold L.A., Eisenberger M., Dorey F.J., Walsh P.C., Partin A.W. Risk of prostate cancer-specific mortality following biochemical recurrence after radical prostatectomy. JAMA. 2005;294:433–439. doi: 10.1001/jama.294.4.433. - DOI - PubMed
    1. Kupelian P.A., Mahadevan A., Reddy C.A., Reuther A.M., Klein E.A. Use of different definitions of biochemical failure after external beam radiotherapy changes conclusions about relative treatment efficacy for localized prostate cancer. Urology. 2006;68:593–598. doi: 10.1016/j.urology.2006.03.075. - DOI - PubMed
    1. Roehl K.A., Han M., Ramos C.G., Antenor J.A.V., Catalona W.J. Cancer progression and survival rates following anatomical radical retropubic prostatectomy in 3,478 consecutive patients: long-term results. J. Urol. 2004;172:910–914. doi: 10.1097/01.ju.0000134888.22332.bb. - DOI - PubMed

Publication types

MeSH terms