. 2025 Jul 3;16(1):6135.
doi: 10.1038/s41467-025-61196-0.

Interleukin-35 impairs human NK cell effector functions and induces their ILC1-like conversion with tissue residency features

Affiliations

Interleukin-35 impairs human NK cell effector functions and induces their ILC1-like conversion with tissue residency features

Valentin Picant et al. Nat Commun. .

Abstract

Natural Killer (NK) cells play pivotal immunological roles including direct cytotoxic effector function and secretion of inflammatory and immunomodulating cytokines. In the context of chronic inflammation, NK cell fitness decreases during disease progression through currently unknown mechanisms. Here, we demonstrate that Interleukin-35 (IL-35) inhibits human NK cell proliferation, pro-inflammatory, and cytotoxic functions, while promoting secretion of TGF-β and proangiogenic factors in vitro. We show prolonged exposure to IL-35 converts both conventional and adaptive NK cells into CD9+CD103+CD49a+ ILC1-like cells via autocrine TGF-β. We assess cancer patient-derived public datasets and reveal the presence of IL-35-producing cells and IL-35-receptor-expressing NK/ILC1-like cells within the tumor microenvironment and associate IL-35 with poor prognosis. Collectively, our findings identify and implicate IL-35 as a key driver of NK cell plasticity, promoting the acquisition of features associated with tissue residency and weakened effector functions, and could be relevant in pathophysiological contexts, highlighting IL-35 as an attractive target for future immunotherapies aimed at enhancing NK cell clinical activity.


Conflict of interest statement

Competing interests: The authors declare no competing interests.

Figures

Fig. 1
Fig. 1. Short-term exposure to IL-35 inhibits human NK cell activation and secretion of pro-inflammatory cytokines/chemokines.
a NK cells were cultured for 24 h with IL-12, IL-15, and IL-18 (10 ng/mL), IL-2 (1000 UI/ml), and IL-35 (100 ng/ml) or their combination. Representative flow cytometry plots for CD25 and IFN-γ expression (upper) and quantification (%) (lower) of CD25+ IFN-γ+ NK cells. Mean values ± S.D are shown (n = 4 individual donors). b Representative raw histograms of IFN-γ, CD25, 4-1BB, PD-L1, LAG3, and CD69 in NK cells (left) and cumulative histogram of % positive NK cells in different culture conditions (right). Mean values ± S.D are shown (n = 5 to 6 individual donors). c Two-dimensional T-sne plots showing NK cell clustering based on surface marker profiles (IFN-γ/CD25/4-1BB/PD-L1/LAG3/CD69), after culture as in Fig. 1b. Representative T-sne (left) and quantification (%) (right) of activated NK cells. Mean values ± S.D are shown (n = 6 individual donors). d Cytokines and chemokines were quantified by ECLIA assay in supernatants from NK cells cultured for 24 h in the presence of IL-12 and IL-18 with or without IL-35. Results are expressed as fold change relative to control without IL-35. Mean values ± S.D are shown (n = 4 to 6 individual donors). e Representative flow cytometry plots (left) and quantification (right) of T-BET and EOMES expression in NK cells cultured as in Fig. 1d. Results are expressed as MFI expression in IL-35 condition relative to control without IL-35. Mean values ± S.D are shown (n = 7 individual donors). f VEGF-A, IL-8, and CCL5 were quantified by ECLIA assay in supernatants from NK cells cultured for 24 h as in Fig. 1b. Mean values ± S.D are shown (n = 3 to 6 individual donors). g Representative raw histograms (upper) and cumulative histograms (lower) of % positive NK cells for GP130, IL-12Rβ2, IL-27Rα after culture as indicated for 24 h. Mean values ± S.D are shown (n = 3 individual donors). Statistical significance was determined using paired T test. Source data are provided as a Source Data file.
Fig. 2
Fig. 2. IL-35 inhibits human NK cell proliferation but not survival.
a Schematic representation of the experimental protocol. NK cells were labeled with CTV at day 0 (D0), pre-activated for 16 h as indicated, and cultured in low dose IL-2 (100 UI/mL) with or without IL-35 (100 ng/ml) for 3, 5, 7, and 9 days (D3, D5, D7, D9, respectively). Images were provided by Servier Medical Art (https://smart.servier.com/), licensed under CC BY 4.0 (https://creativecommons.org/licenses/by/4.0/). b Representative flow cytometry plots for CTV fluorescence intensity for all pre-activation conditions and c, d quantification of % cycling cells and number of cells that were primed in medium and after 3, 5, 7, and 9 days of proliferation in IL-2 versus IL-2 + IL-15. Mean values ± S.D are shown (n = 4 to 5, and 3 individual donors, respectively). e Quantification of the proportion of viable NK cells for all pre-activation conditions after 3, 5, 7 and 9 days of proliferation in IL-2 with or without IL-35. Results are expressed as fold change compared to the IL-2 control condition without IL-35. Mean values ± S.D are shown (n = 3 to 5 individual donors). Statistical significance was determined using paired T test. Source data are provided as a Source Data file.
Fig. 3
Fig. 3. Long term exposure to IL-35 leads to NK cell hyporesponsiveness and altered NK cell surface receptor expression.
a Schematic representation of the experimental protocol. NK cells were cultured in low dose IL-2 (100 UI/mL) with or without IL-35 (100 ng/ml) for 7 days and then used for phenotyping analysis, cocultured with K562 at 1:1, 1:2, 1:5 E/T ratio for 4 h (cytotoxicity assay) or with IL-12 and IL-18 for 16 h (cytokine production analysis). Images were provided by Servier Medical Art (https://smart.servier.com/), licensed under CC BY 4.0 (https://creativecommons.org/licenses/by/4.0/). b Representative flow cytometry plots for IFN-γ expression (left) and quantification of IFN-γ production (% and MFI) (right) after 7 days in IL-2 with or without IL-35 followed by IL-12 and IL-18 for 16 h. Mean values ± S.D are shown (n = 5 individual donors). c Cytokines and chemokines were quantified by ECLIA assay in NK supernatants after 7d-culture in IL-2 with or without IL-35 followed by IL-12 and IL-18 for 16 h. Results are expressed as fold change in IL-35 compared to control without IL-35. Mean values ± S.D are shown (n = 6 individual donors). d Representative flow cytometry plots for AnnexinV/PI expression (left) and quantification of % dead K562 cells (right) after 7d-culture of NK cells in IL-2 with or without IL-35 followed by 4h-coculture NK/K562. Mean values ± S.D are shown (n = 5 individual donors). e Representative flow cytometry plots (left) and quantification of activating receptors’ expression (right) after 7d-culture, as indicated in Fig. 3a. Results are expressed as MFI in IL-35 relative to control without IL-35. Mean values ± S.D are shown (n = 7 individual donors). f Representative two-dimensional T-sne plots showing NK cell clustering based on NKp30, NKp44, NKp46, DNAM1, NKG2D expression (n = 7 individual donors). g Representative flow cytometry plots (left) and quantification of inhibitory receptors’ expression (right) after 7d-culture, as indicated in Fig. 3a. Results are expressed as MFI in IL-35 relative to control without IL-35. Mean values ± S.D are shown (n = 6 to 7 individual donors). h Representative two-dimensional T-sne plots showing NK cell clustering based on NKG2A, TIGIT, TIM3, PD-L1, CD96, LAG3 expression (n = 6 to 7 individual donors). Statistical significance was determined using paired T test. Source data are provided as a Source Data file.
Fig. 4
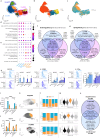
Fig. 4. scRNA-seq reveals transcriptional regulation and mechanisms involved in NK cell subsets’ response to IL-35.
a–c UMAP of human purified NK cells cultured in IL-2 with or without IL-35 for 2 or 4 days from two different healthy donors. Cells are colored according to a the unsupervised clustering, b the proliferation phase, and c the treatment received. d, e Pathway signatures enriched (Fisher’s test adjusted P-value < 0.01) in genes up-regulated in absence or presence of IL-35 in ConvNK, AdaptNK and ProlifNK. f, g Venn diagram of significantly f downregulated or g upregulated genes in IL-2 + IL-35-exposed cells compared to IL-2-exposed control cells, by comparing ConvNK, AdaptNK, and ProlifNK being respectively colored in light blue, dark blue and pink. h Representative raw histograms of GP130, IL-12Rβ2, IL-27Rα in NKG2C+ versus NKG2C- NK cells that were cultured as indicated for 24 h (left). Cumulative histograms of % positive NK cells for each marker (right). Mean values ± S.D are shown (n = 3 individual donors). i, j Supernatants from sorted NKG2C+ and NKG2C- NK cells cultured for 24 h in the presence of IL-12 and IL-18 with or without IL-35 were collected to quantify i IFN-γ and  j VEGF-A release by ECLIA assay. Results are expressed as pg/ml. Mean values ± S.D are shown (n = 3 individual donors). k UMAP of AdaptNK (top), ConvNK (middle), and ProlifNK (bottom). Cells are colored according to the unsupervised clustering. l Frequency of IL-2-treated or IL-2 + IL-35-treated cells in each Seurat cluster among AdaptNK (top), ConvNK (middle) and ProlifNK (bottom). m Violin plots showing the distribution across Seurat clusters of the ILC1-like signature score among AdaptNK (top), ConvNK (middle) and ProlifNK (bottom). n Venn diagram of the top50 most highly expressed genes among genes specifically expressed in the identified ILC1-like cluster versus other clusters from AdaptNK (dark blue) and ConvNK (light blue). Source data are provided as a Source Data file.
Fig. 5
Fig. 5. IL-35 drives the conversion of human NK cells into an irreversible ILC1-like phenotype.
a Two-dimensional T-sne plots showing NK cell clustering based on residency surface marker profiles (CD103, CD9, CD49a) after 2, 4, and 8 days in culture (D2, D4, D8, respectively) with IL-2 + /− IL-35. Representative T-sne (upper left and lower) and quantification (%) (upper right) of ILC1-like cells as defined by the combined expression of CD103, CD9 and CD49a. Mean values ± S.D are shown (n = 3 individual donors). b, c Representative flow cytometry plots (left) and quantification of EOMES and T-BET MFI expression in NK cells cultured for 8 days in the presence of IL-2 with or without IL-35. Mean values ± S.D are shown (n = 6 and 5 individual donors, respectively). d Representative flow cytometry plots (left) and quantification (right) of % and MFI CD9, CD103, and CD49a expression in ILC1-like cells after 8 days of culture in the presence of IL-2 with IL-35 according to their proliferation status (cycling vs non-cycling) based on CTV fluorescence intensity. Mean values ± S.D are shown (n = 3 individual donors). e Quantification of IFN-γ expression in NK cells at day 7 following 48 h (2 d) in indicated culture conditions. Results are expressed as relative MFI compared to control condition IL-2 (5 d) -> IL-2 (2 d). Mean values ± S.D are shown (n = 5 individual donors). f Representative flow cytometry plots (left) and quantification (%) of CD9+ CD103+ NK (right) after 5 days (5 d) in culture with IL-2 with or without IL-35 (D5) and at day 7 (D7) following 48 h (2 d) in indicated culture conditions. Mean values ± S.D are shown (n = 5 individual donors). Statistical significance was determined using paired T test. Source data are provided as a Source Data file.
Fig. 6
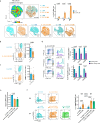
Fig. 6. IL-35-triggered autocrine TGF-β drives NK cell dysfunction and conversion into ILC1-like cells.
a TGFB1 expression in total NK cells cultured for 2 and 4 days in IL-2 with or without IL-35 (analyzed from our scRNA-seq dataset). b Supernatants from NK cells cultured for 24 h in the presence of medium versus IL-12 and IL-18 with or without IL-35 were collected to quantify active TGF-β1 by ELISA. Mean values ± S.D are shown (n = 7 individual donors). c Representative images of NK cells after 7 days of culture in IL-2 with or without IL-35 and a TGF-βR inhibitor (Galunisertib). d Representative flow cytometry plots (upper) and quantification of IFN-γ, T-BET, and EOMES expression (lower) in NK cells at 24 h of culture in IL-12 + IL-18 with or without IL-35, TGF-βR inhibitor (Galunisertib) or anti-TGF-β1/2/3 neutralizing antibody. Results are expressed as relative MFI for each marker compared to control condition without IL-35. Mean values ± S.D are shown (n = 4 to 5 individual donors). e Representative flow cytometry plots (left) for IFN-γ expression in NK cells after 5 days in culture with IL-2 with or without IL-35 and TGF-βR inhibitor (Galunisertib) and quantification (right) of % IFN-γ+ cells in the same culture conditions. Mean values ± S.D are shown (n = 4 individual donors). f Representative flow cytometry plots (left) for CD9 and CD103 expression in NK cells after 8 days in culture with IL-2 with or without IL-35, TGF-βR inhibitor (Galunisertib) or anti-TGF-β1/2/3 neutralizing antibody and quantification (right) of % CD9+ CD103+ cells in the same culture conditions. Mean values ± S.D are shown (n = 3 to 6 individual donors). Statistical significance was determined using paired T test. Source data are provided as a Source Data file.
Fig. 7
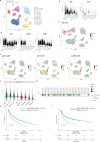
Fig. 7. NK/ILC1-like cells expressing IL-35R are present in tumors and IL-35 is associated with poor prognosis in cancer.
a UMAP embedding of a pan-cancer single-cell RNA-seq atlas comprising 354,379 cells, encompassing both immune and non-immune populations following quality control, standard preprocessing, and upstream analysis. b Violin plots showing normalized expression levels of IL-35 subunit genes (EBI3 and IL12A) across selected immune cell populations. Expression values are plotted on a shared scale and populations are ranked in descending order based on their average expression level. c UMAP embedding of joint expression density for IL-35 cytokine genes, inferred using a Kernel Density Estimator (KDE) to capture co-expression of EBI3 and IL12A at the single-cell level. The joint density corresponds to the weighted average density of individual gene KDEs. d Violin plots displaying normalized expression levels of IL-35 receptor components (IL6ST, IL12RB2, and IL27RA) across selected immune cell populations. Expression values are plotted on a shared scale and populations are ranked by mean expression level. e UMAP embedding of joint expression density for IL-35 receptor combinations, inferred via Kernel Density Estimation (KDE) to assess co-expression of IL6ST with IL12RB2, IL6ST with IL27RA, and IL12RB2 with IL27RA. The joint density corresponds to the weighted average density of individual gene KDEs. f Violin plots showing enrichment scores of an ILC1-like transcriptional signature across immune cell populations of interest. Populations are ranked by module enrichment score. g Bubble map showing the correlation coefficient for EBI3 and IL12A in TCGA datasets: adrenocortical carcinoma (ACC), bladder urothelial carcinoma (BLCA), breast invasive carcinoma (BRCA), cervical carcinoma (CESC), cholangiosarcoma (CHOL), colorectal adenocarcinoma (COAD), diffuse large B-cell lymphoma (DLBC), esophageal carcinoma (ESCA), glioblastoma multiforme (GBM), head and neck squamous cell carcinoma (HNSC), kidney chromophobe carcinoma (KICH), kidney clear renal cell carcinoma (KIRC), kidney papillary cell carcinoma (KIRP), lower grade glioma (LGG), liver hepatocellular carcinoma (LIHC), lung adenocarcinoma (LUAD), lung squamous cell carcinoma (LUSC), mesothelioma (MESO), ovarian serous cystadenocarcinoma (OV), pancreatic adenocarcinoma (PAAD), paraganglioma & pheochromocytoma (PCPG), prostate adenocarcinoma (PRAD), rectum adenocarcinoma (READ), sarcoma (SARC), skin cutaneous metastatic melanoma (SKCM), stomach adenocarcinoma (STAD), testicular germ cell cancer (TGCT), thyroid carcinoma (THCA), thymoma (THYM), uterine corpus endometrial carcinoma (UCEC), uterine carcinosarcoma (UCS) and uveal melanoma (UVM). Positive (green) and negative (red) correlation are highlighted, based on p-val<0.05. Dots size represents absR, Pearson correlation coefficient. h Patients from TCGA database were stratified as high or low for EBI3, IL12A, and IL12B based on the median and overall survival was analyzed in pan-cancer solid tumors data set. Kaplan-Meier survival curves for patients are represented and p-values were obtained with log-rank test. EBI3hi IL12Ahi IL12Blo were classified as IL-35+ and compared to other categories. i Patients from TCGA database (solid tumors only) were stratified as high or low for EBI3, IL12A, and IL12B based on the median and progression-free survival was analyzed in pan-cancer (solid tumors) data set. Kaplan-Meier survival curves for patients are represented and p-values were obtained with log-rank test. EBI3hi IL12Ahi IL12Blo were classified as IL-35+ group and compared to other categories.

References

    1. Vivier, E. et al. Innate Lymphoid Cells: 10 Years On. Cell174, 1054–1066 (2018). - PubMed
    1. Malmberg, K.-J. et al. Natural Killer Cell-Mediated Immunosurveillance of Human Cancer. Semin Immunol.31, 20–29 (2017). - PubMed
    1. Wolf, N. K., Kissiov, D. U. & Raulet, D. H. Roles of Natural Killer Cells in Immunity to Cancer, and Applications to Immunotherapy. Nat. Rev. Immunol.23, 90–105 (2023). - PubMed
    1. Huntington, N. D., Cursons, J. & Rautela, J. The Cancer-Natural Killer Cell Immunity Cycle. Nat. Rev. Cancer20, 437–454 (2020). - PubMed
    1. Dean, I. et al. Rapid Functional Impairment of Natural Killer Cells Following Tumor Entry Limits Anti-Tumor Immunity. Nat. Commun.15, 683 (2024). - PMC - PubMed

MeSH terms

LinkOut - more resources