. 2025 Jul 3;16(1):490.
doi: 10.1038/s41419-025-07825-4.

Erythropoietin decreases apoptosis and promotes Schwann cell repair and phagocytosis following nerve crush injury in mice

Affiliations

Erythropoietin decreases apoptosis and promotes Schwann cell repair and phagocytosis following nerve crush injury in mice

Prem Kumar Govindappa et al. Cell Death Dis. .

Abstract

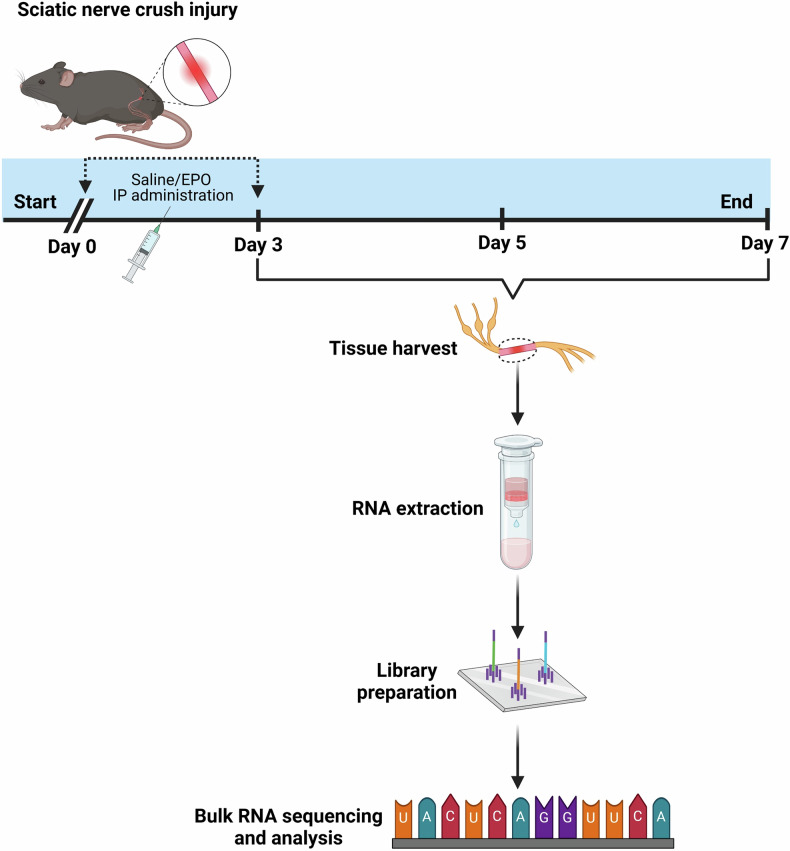
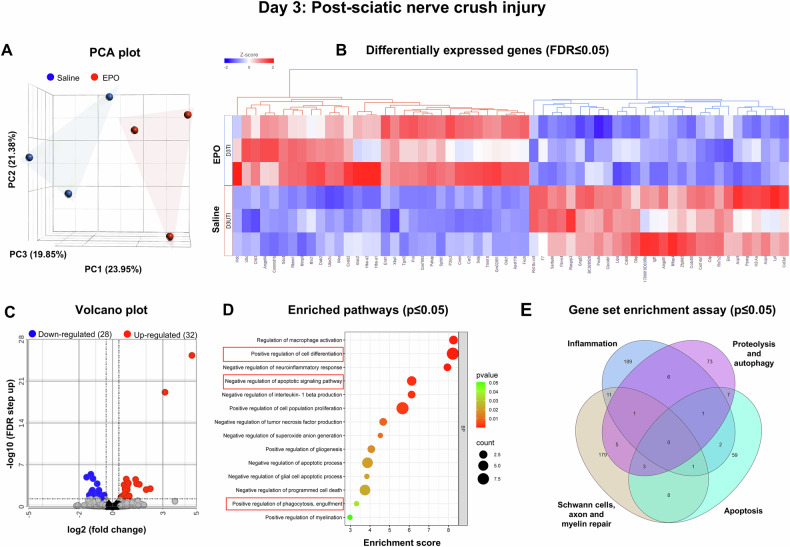
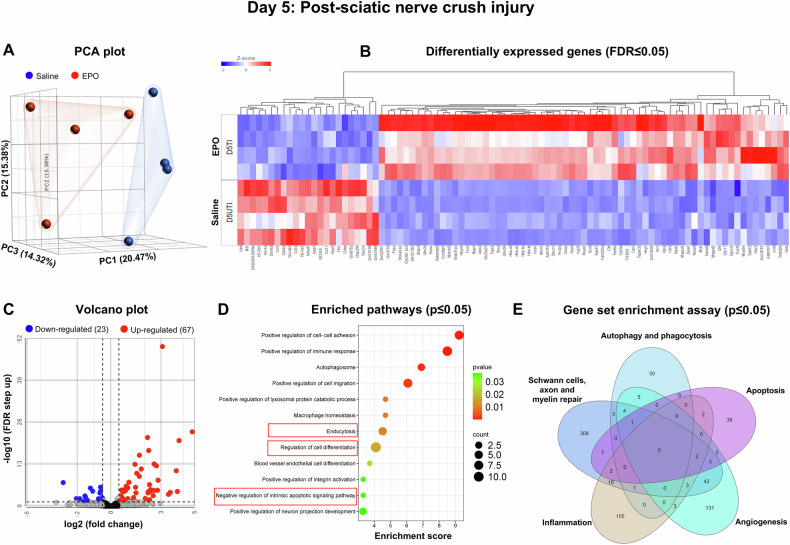
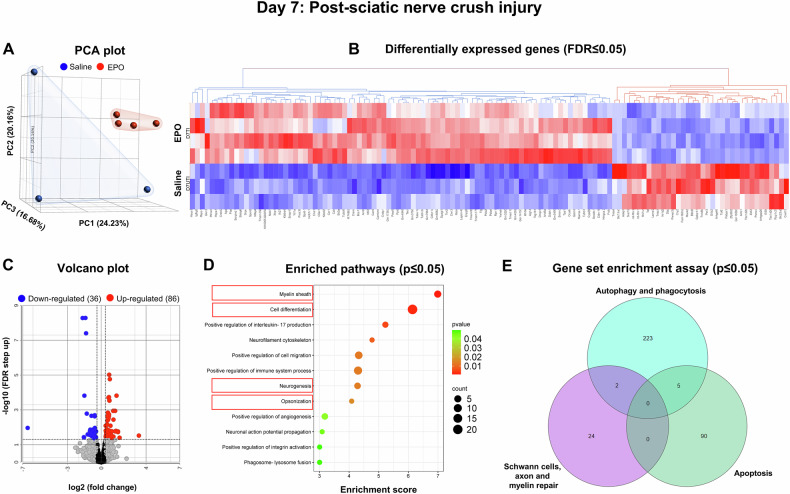
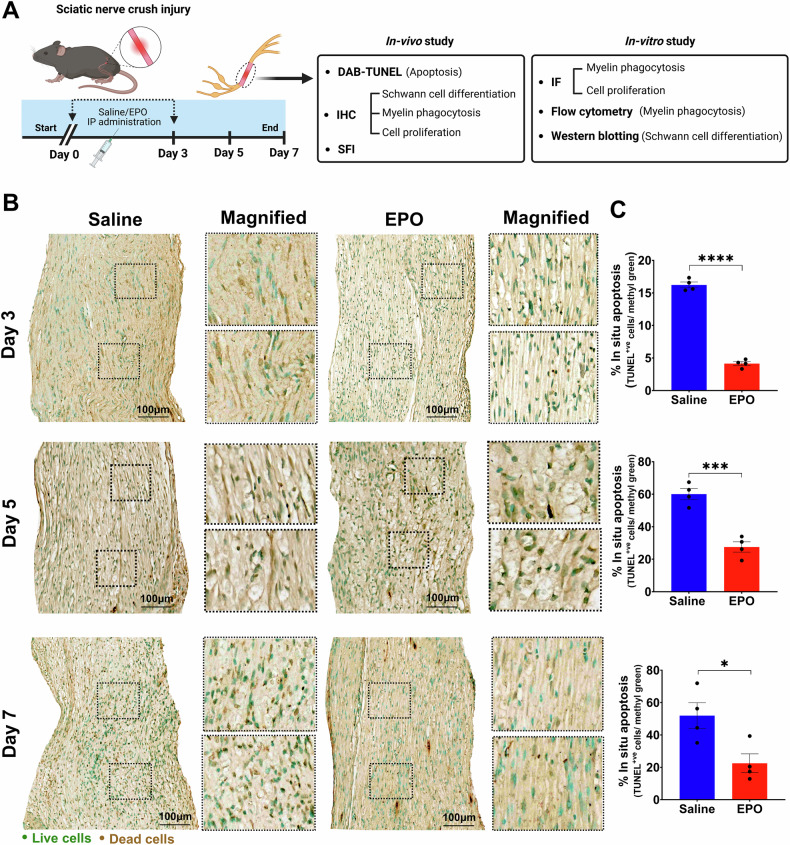
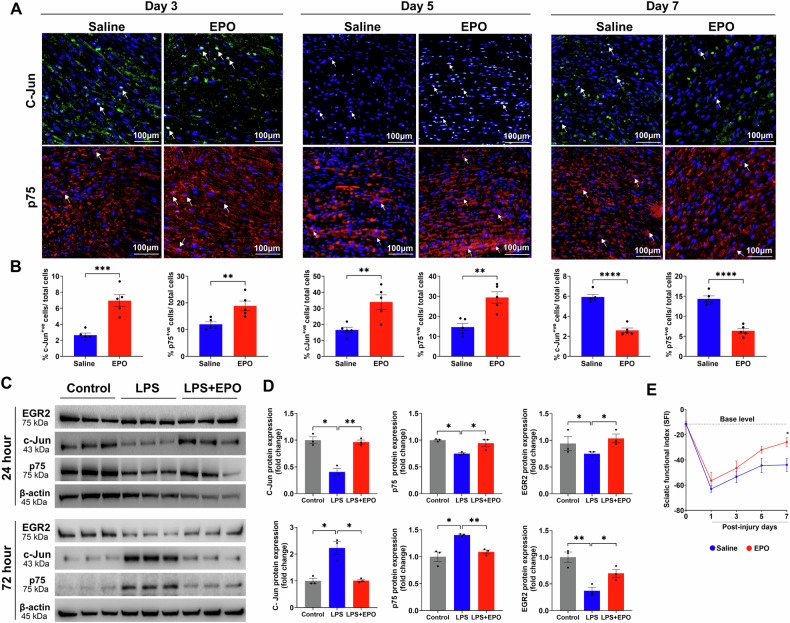
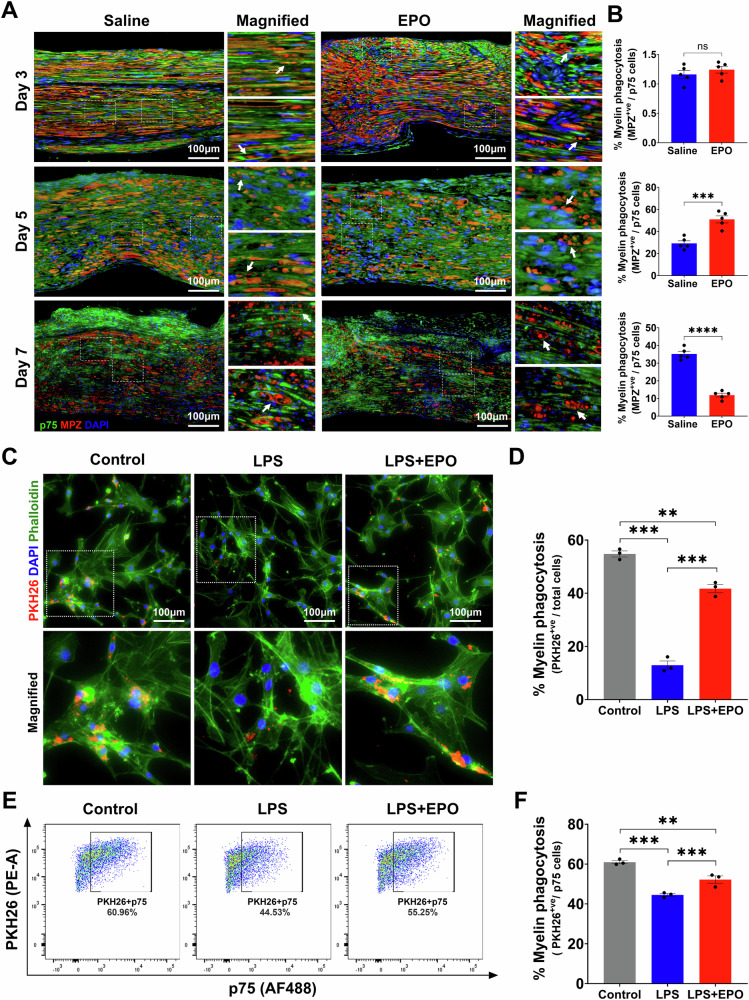
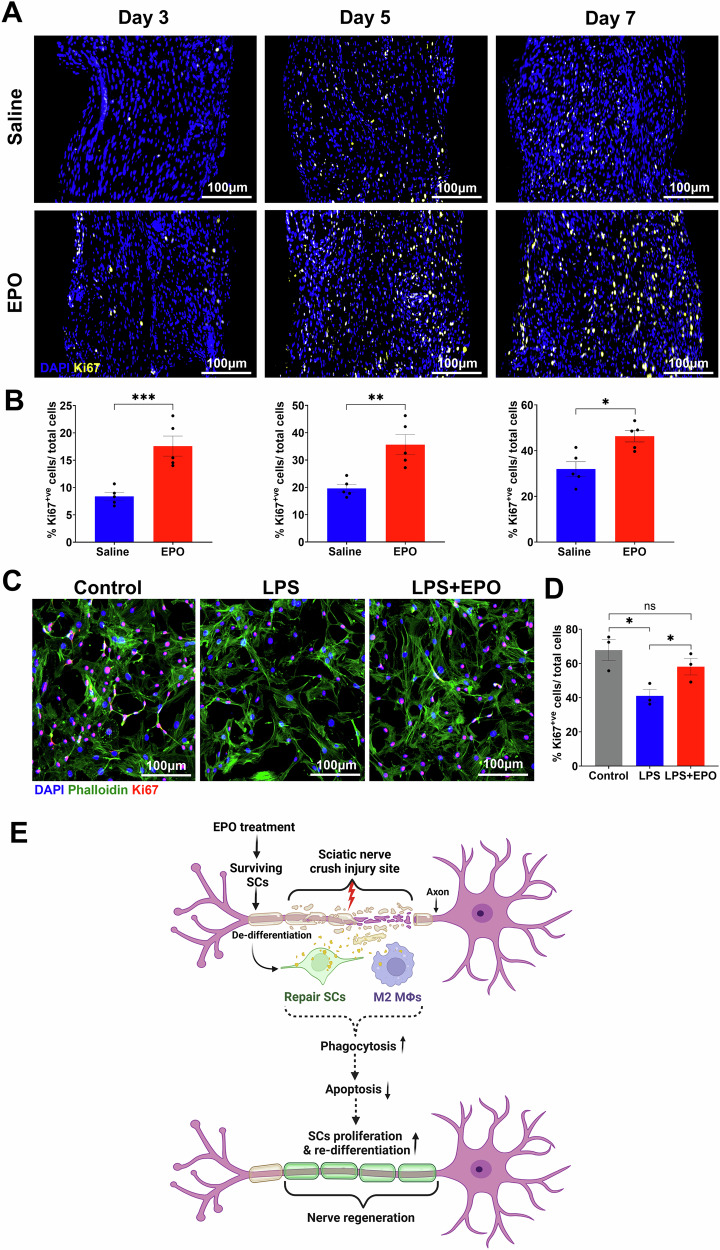
After peripheral nerve trauma, insufficient clearance of phagocytic debris significantly hinders nerve regeneration. Without sufficient myelin debris clearance, Schwann cells (SCs) undergo increased apoptosis, impairing functional recovery. There is no treatment for peripheral nerve crush injury (PNCI). Erythropoietin (EPO) is an FDA-approved drug for anemia, which may help in the treatment of PNCI by transdifferentiating resident SCs into repair SCs (rSCs) and enhancing phagocytosis to facilitate the removal of cellular debris. For the first time, we conducted bulk RNA sequencing on mice with calibrated sciatic nerve crush injuries (SNCIs) on days 3, 5, and 7 post-SNCI to uncover transcriptomic changes with and without EPO treatment. We found EPO altered several biological pathways and associated genes, particularly those involved in cell apoptosis, differentiation, proliferation, phagocytosis, myelination, and neurogenesis. We validated the effects of EPO on SNCI on early (day 3) and intermediate (days 5 and 7) post-SNCI, and found EPO treatment reduced apoptosis (TUNEL), and enhanced SC repair (c-Jun and p75), proliferation (Ki67), and the phagocytosis of myelin debris by rSCs at crush injury sites. This improvement corresponded with an enhanced sciatic functional index (SFI). We also confirmed these findings in-vitro. EPO significantly enhanced SC repair during early de-differentiation, marked by high c-Jun and p75 protein levels, and later re-differentiation with high EGR2 and low c-Jun and p75 levels. These changes occurred under lipopolysaccharide (LPS) stress at 24 and 72 h, respectively, compared to LPS treatment alone. Under LPS stress, EPO also significantly increased rSCs proliferation and phagocytosis of myelin or dead SCs. In conclusion, our findings support EPO may enhance the function of rSCs in debris clearance as a basis for its possible use in treating nerve trauma.


Conflict of interest statement

Competing interests: The authors declare no competing interests. Ethical approval: Our manuscript does not contain any human data. Experimental design and animal protocols were approved by the Institutional Animal Care and Use Committee (IACUC) at The University of Arizona College of Medicine, Tucson, AZ, and The Penn State University, Hershey, PA, USA. All experiments were conducted following the approved guidelines and regulations.

Figures

Fig. 1
Fig. 1. Illustration of the experimental design.
Bulk RNA sequencing of nerve tissues from EPO- and saline-treated mice following sciatic nerve crush injury.
Fig. 2
Fig. 2. On Day 3, bulk RNA sequencing revealed EPO-enriched genes for biological pathways in nerves following SNCI.
A Principal component analysis (PCA) plot shows RNA-sequence transcriptomes (saline-blue; EPO-red). B Heat map depicts the top upregulated (red) and downregulated (blue) differentially expressed genes (DEGs) (FDR ≤ 0.05). C Up and down-regulated DEGs were illustrated in volcano plots to show log 2 (fold change) on the x-axis and significant -log10 (FDR step up) on the y-axis. D Enriched pathways from the DEGs are represented on the y-axis with their associated gene numbers, while the x-axis displays the enrichment score for each pathway. E The Venn diagram illustrates the number of significantly expressed genes (p ≤ 0.05) within pathways identified through a gene set enrichment assay. Saline vs. EPO treatment, n = 3/group.
Fig. 3
Fig. 3. On Day 5, bulk RNA sequencing revealed EPO-enriched genes for biological pathways in nerves following SNCI.
A Principal component analysis (PCA) plot shows RNA-sequence transcriptomes (saline-blue; EPO-red). B Heat map depicts the top upregulated (red) and downregulated (blue) differentially expressed genes (DEGs) (FDR ≤ 0.05). C Up and down-regulated DEGs were illustrated in volcano plots to show log 2 (fold change) on the x-axis and significant -log10 (FDR step up) on the y-axis. D Enriched pathways from the DEGs are represented on the y-axis with their associated gene numbers, while the x-axis displays the enrichment score for each pathway. E The Venn diagram illustrates the number of significantly expressed genes (p ≤ 0.05) within pathways identified through a gene set enrichment assay. Saline vs. EPO treatment, n = 4/group.
Fig. 4
Fig. 4. On Day 7, bulk RNA sequencing revealed EPO-enriched genes for biological pathways in nerves following SNCI.
A Principal component analysis (PCA) plot shows RNA-sequence transcriptomes (saline-blue; EPO-red). B Heat map depicts the top upregulated (red) and downregulated (blue) differentially expressed genes (DEGs) (FDR ≤ 0.05). C Up and down-regulated DEGs were illustrated in volcano plots to show log 2 (fold change) on the x-axis and significant -log10 (FDR step up) on the y-axis. D Enriched pathways from the DEGs are represented on the y-axis with their associated gene numbers, while the x-axis displays the enrichment score for each pathway. E The Venn diagram illustrates the number of significantly expressed genes (p ≤ 0.05) within pathways identified through a gene set enrichment assay. Saline vs. EPO treatment, n = 3 and 4/group.
Fig. 5
Fig. 5. EPO attenuated apoptosis following SNCI.
A Illustration of the experimental design for in-vivo and in-vitro cell culture studies. B, C Representative images of DAB-TUNEL staining of apoptosis and quantitative results of percent in situ apoptosis (TUNEL positive cells/methyl green) in saline and EPO treated SNCI tissues on days 3, 5, and 7. n = 4/group. Data are represented as mean ± SEM. The statistical significance is indicated by asterisks (*P < 0.05 and ****P < 0.0001 vs. saline group) and compared using two-tailed, unpaired t-tests.
Fig. 6
Fig. 6. EPO promoted trans-differentiation of Schwann cells and functional recovery following SNCI.
Representative IF images and quantitative results of c-Jun and p75 (A, B) expressions in saline and EPO treated nerve tissues on post-SNCI days 3, 5, and 7. n = 5/group/time point. C, D Western blotting images and quantitative results of dedifferentiated (c-Jun and p75) and redifferentiated (EGR2) SCs following 24 and 72 h EPO (10 IU/mL) treatment under LPS (500 ng/mL) stress conditions. n = 3/group. E Representation of % sciatic functional index (SFI) untreated vs. EPO treatment. n = 5/group. Data are represented as mean ± SEM. The statistical significance is indicated by asterisks (*P < 0.05, **P < 0.0021, ***P < 0.0002, and ****P < 0.0001 vs. saline group) and compared using two-tailed, unpaired t-tests or ordinary one-way ANOVA.
Fig. 7
Fig. 7. EPO enhanced Schwann cell phagocytosis of cellular debris following SNCI.
A, B Representative IF images and quantitative results of repair SCs (anti-p75 staining) phagocytosis of myelin debris (anti-MPZ staining) in saline and EPO treated nerve tissues on post-SNCI days 3, 5, and 7. n = 5/group. C, D Representative IF images and quantitative results of repair SCs (phalloidin staining) phagocytosis of myelin debris (PKH26 staining) following 24 h EPO (10 IU/mL) treatment under LPS (500 ng/mL) stress conditions. n = 3/group. E, F Flow cytometry images and quantitative results of repair SCs (p75 positive cells) phagocytosis of myelin debris (PKH26 staining) following 24 h EPO (10 IU/mL) treatment under LPS (500 ng/mL) stress conditions. n = 3/group. Data are represented as mean ± SEM. The statistical significance is indicated by asterisks (**P < 0.0021, ***P < 0.0002, and ****P < 0.0001 vs. saline group) and compared using two-tailed, unpaired t-tests or ordinary one-way ANOVA.
Fig. 8
Fig. 8. EPO increased cell proliferation in nerve tissues following SNCI.
A, B Representative IF images and quantitative cell proliferation results (anti-Ki67 staining) in saline and EPO-treated nerve tissues on post-SNCI days 3, 5, and 7. n = 5/group. C, D Representative IF images and quantitative results of repair SCs (phalloidin staining) % proliferation (Ki67 positive cells/total cells) following 24 h EPO (10 IU/mL) treatment under LPS (500 ng/mL) stress conditions. n = 3/group. Data are represented as mean ± SEM. The statistical significance is indicated by asterisks (*P < 0.05 and ***P < 0.0002 vs. saline group) and compared using two-tailed, unpaired t-tests or ordinary one-way ANOVA. E A schematic illustration of the role of EPO in rSCs, M2 MΦ myelin phagocytosis, and nerve regeneration following SNCI.

Update of

Similar articles

References

    1. Govindappa PK, Elfar JC. Erythropoietin promotes M2 macrophage phagocytosis of Schwann cells in peripheral nerve injury. Cell Death Dis. 2022;13:245. - PMC - PubMed
    1. Wang J-L, Huang Q-M, Hu D-X, Zhang W-J. Therapeutic effect of exosomes derived from Schwann cells in the repair of peripheral nerve injury. Life Sci. 2024;357:123086. - PubMed
    1. Yuan Y, Wang Y, Wu S, Zhao MY. Review: myelin clearance is critical for regeneration after peripheral nerve injury. Front Neurol. 2022;13:908148. - PMC - PubMed
    1. Brosius Lutz A, Chung W-S, Sloan SA, Carson GA, Zhou L, Lovelett E, et al. Schwann cells use TAM receptor-mediated phagocytosis in addition to autophagy to clear myelin in a mouse model of nerve injury. Proc Natl Acad Sci USA. 2017;114:E8072–E8080. - PMC - PubMed
    1. Nocera G, Jacob C. Mechanisms of Schwann cell plasticity involved in peripheral nerve repair after injury. Cell Mol Life Sci. 2020;77:3977–89. - PMC - PubMed

MeSH terms