. 2025 Jul 3;16(1):6122.
doi: 10.1038/s41467-025-61105-5.

The intracellular bacterium Orientia tsutsugamushi uses the autotransporter ScaC to activate BICD adaptors for dynein-based motility

Affiliations

The intracellular bacterium Orientia tsutsugamushi uses the autotransporter ScaC to activate BICD adaptors for dynein-based motility

Giulia Manigrasso et al. Nat Commun. .

Abstract

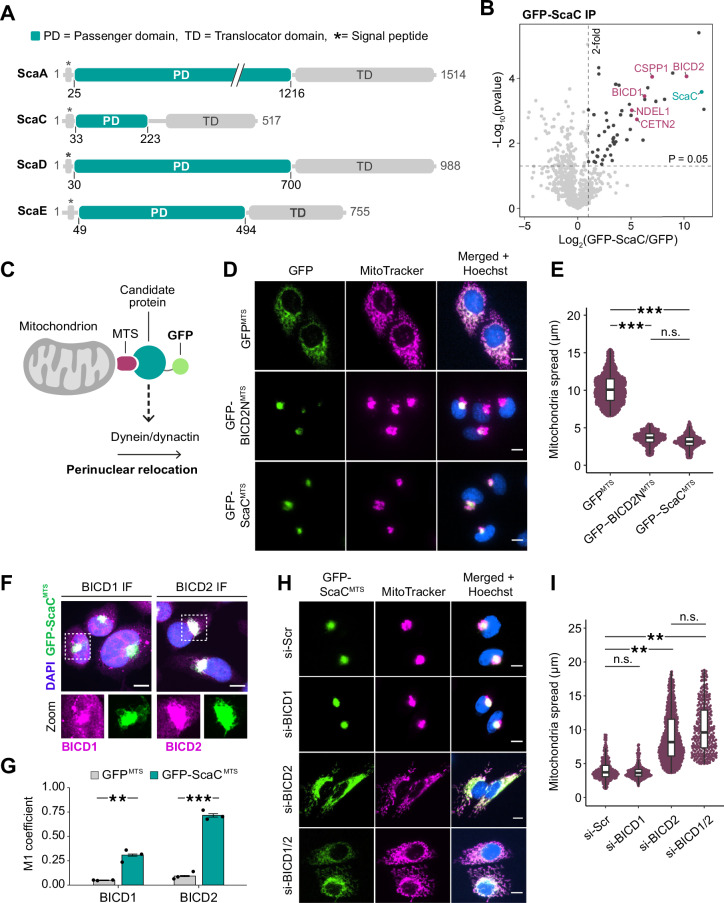
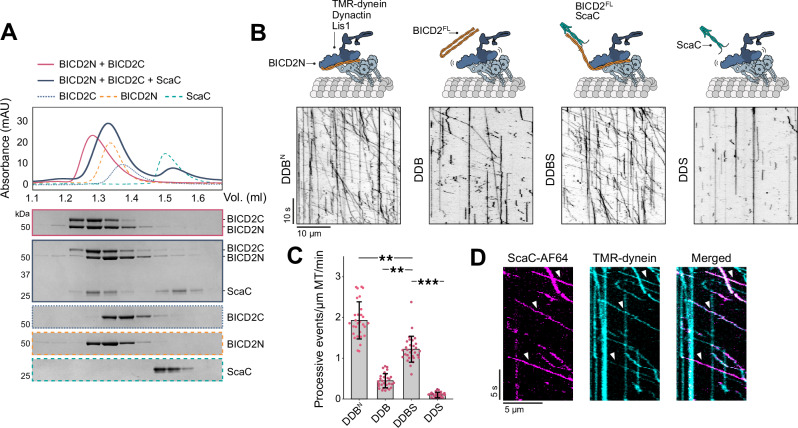
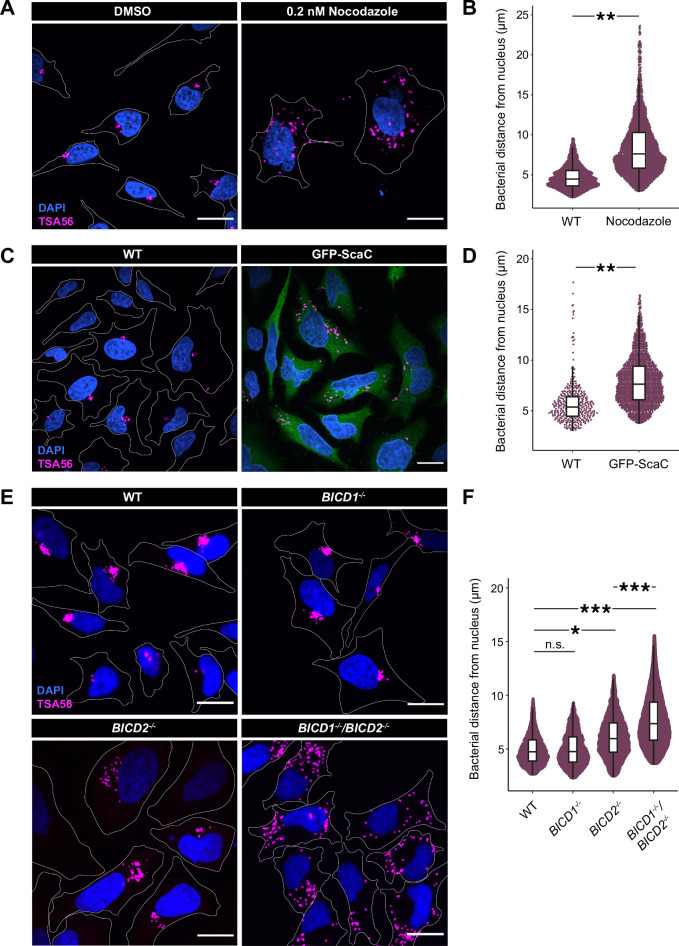
The intracellular bacterium Orientia tsutsugamushi relies on the microtubule cytoskeleton and the motor protein dynein to traffic to the perinuclear region within infected cells. However, it remains unclear how the bacterium is coupled to the dynein machinery and how transport is regulated. Here, we discover that O. tsutsugamushi uses its autotransporter protein ScaC to recruit the dynein adaptors BICD1 and BICD2 for movement to the perinucleus. We show that ScaC is sufficient to engage dynein-based motility in the absence of other bacterial proteins and that BICD1 and BICD2 are required for efficient movement of O. tsutsugamushi during infection. Using TIRF single-molecule assays, we demonstrate that ScaC induces BICD2 to adopt an open conformation which activates the assembly of dynein-dynactin complexes. Our results reveal a role for BICD adaptors during bacterial infection and provide mechanistic insights into the life cycle of an important human pathogen.


Conflict of interest statement

Competing interests: The authors declare no competing interests.

Figures

Fig. 1
Fig. 1. The bacterial surface protein ScaC binds the activating adaptors BICD1 and BICD2.
A Domain architecture of conserved Sca proteins. The passenger domains are highlighted in green. B Volcano plot summarising the results of GFP-ScaC co-IP/MS in HeLa Flp-In cells. The significant enrichment levels were calculated from n = 3 independent replicates using a two-sided t-test. Peptide identifications were filtered for high confidence using the Percolator node (FDR < 1%, rank 1 peptides). GFP-ScaC is highlighted in green. Proteins with known links to microtubules are indicated in magenta. C Visual schematic of the mitochondrial relocation assay. D Representative images of mitochondrial relocation assay with GFPMTS, GFP-BICD2NMTS and GFP-ScaCMTS cell lines. Scale bars indicate 10 μm. E Quantification of mitochondrial spread for GFPMTS, GFP-BICD2NMTS and GFP-ScaCMTS samples. The beeswarm plot includes all values between 5th and 95th percentiles. The box plot centre indicates the median, the boxes show the 25th/75th percentile, and whiskers extend to the largest or smallest values within 1.5 × IQR from the hinges. P-values were calculated from n = 3 independent replicates using two-tailed ANOVA with a Tukey HSD pot-hoc test. ***p < 0.001. GTPMTS:GFP-BICD2NMTS p = 6.2 × 10−5, GFPMTS:GFP-ScaCMTS p = 5.1 × 10−5 F Representative IF images showing colocalization of GFP-ScaCMTS with BICD1 and BICD2 respectively. Scale bars indicate 5 μm. G Barplot showing colocalization of BICD1 and BICD2 with GFPMTS (grey) or GFP-ScaCMTS (green). Colocalization was measured using the Manders coefficient (M1). P-values were calculated from n = 3 independent replicates using a two-tailed T-test. Error bars indicate mean ± standard error. **p < 0.01, ***p < 0.001. BICD1 p = 0.002, BICD2 p = 6.3 × 10-5 (H) Representative images of GFP-ScaCMTS cells treated with siRNAs against BICD1 and/or BICD2. A scrambled siRNA (si-Scr) was used as a negative control. Scale bars indicate 10 μm. I Quantification of mitochondrial spread in siRNA-treated GFP-ScaCMTS cells. The beeswarm and box plots are as described in (E). P-values were calculated from n = 3 independent replicates using two-tailed ANOVA with a Tukey HSD pot-hoc test. si-Scr:siBICD2 p = 0.005, si-Scr:si-BICD1/2 p = 0.002. Source data are provided as a Source Data file.
Fig. 2
Fig. 2. ScaC binds the C-terminus of BICD2.
A Chromatogram for the BICD2-ScaC complex (black). Purified BICD2 and ScaC were mixed in 1:2 molar ratio. Individual traces for BICD2 (orange) and ScaC (green) are shown. SDS-PAGE gels show fractions underlying the relevant protein peaks. This SEC experiment was repeated three times (B) SEC-MALS for the BICD2-ScaC complex. The molar mass of the complex is indicated. C Schematic diagram showing mapping of the ScaC-binding domain (highlighted in grey) using BICD2 truncations. D Crosslinking/MS of purified BICD2-ScaC complexes using ECD. Heteromeric crosslinks are shown. E Chromatogram of the BICD2-ScaC59-159 complex. The SDS-PAGE gel shows fractions underlying the complex peak. This SEC experiment was repeated three times (F) AlphaFold prediction of BICD2711-800. The residues involved in binding to RANBP2 and RAB6 are highlighted in pink and green respectively. G SDS-PAGE gels showing in vitro pull-downs of different Strep-BICD2711-800 mutants in the presence of 3.5-fold excess GCN4-RANBP2min, RAB6Q72L or ScaC. This pulldown experiment was repeated three times (H) Competition pull-down assay using Strep-BICD2711-800 in the presence of different combinations of GCN4-RANBP2min, RAB6Q72L and ScaC-SNAP. I Quantification of GCN4-RANBP2min (top) and RAB6Q72L (bottom) binding to Strep-BICD2711-800 in the absence or presence of ScaC-SNAP. Error bars indicate mean ± standard deviation. P-values were calculated from n = 3 independent replicates using a two-tailed T-test. **p < 0.01. RANBP2 p = 8.8 × 10-5. RAB6 p = 0.0025. Source data are provided as a Source Data file.
Fig. 3
Fig. 3. ScaC activates BICD2 for dynein-based motility.
A SEC chromatograms showing that BICD2N and BICD2C form a complex (purple trace and gel) that is disrupted upon BICD2C binding to ScaC (blue trace and gel). Individual traces and gels (dotted lines) for BICD2N, BICD2C and ScaC show where these proteins elute on their own. SDS-PAGE gels show fractions underlying the relevant protein peaks. This SEC experiment was repeated three times (B) Representative kymographs of TMR-dynein mixed with dynactin and Lis1 in the presence of either BICD2N, full-length BICD2, full-length BICD2 and ScaC or ScaC only. C Barplot showing the number of processive events per microtubule μm per minute for different complex combinations (as in B). P-values were calculated from n = 3 independent replicates using two-tailed ANOVA with a Tukey HSD pot-hoc test. Error bars indicate mean ± standard deviation. **p < 0.01, ***p < 0.001. DDBN:DDBS p = 0.009, DDB:DDBS p = 0.005, DDBS:DDS p = 0.0005 (D) Representative kymographs showing colocalization of Scac-AF674 (magenta) and TMR-dynein (cyan). Arrows indicate colocalization events. Scale bars are shown. Source data are provided as a Source Data file.
Fig. 4
Fig. 4. BICD1 and BICD2 are required for perinuclear transport of O. tsutsugamushi.
A Representative images showing the localization of O. tsutsugamushi strain UT76 (labelled with an antibody against the bacterial surface protein TSA56) at 2 dpi in HeLa ATCC CCL-2 cells treated with either DMSO or 0.2 nM nocodazole. Scale bars indicate 10 μm. B Quantification of bacterial distance from the nucleus (μm) in DMSO- and nocodazole-treated samples. The beeswarm plot includes all values between 5th and 95th percentiles. The box plot centre indicates the median, the boxes show the 25th/75th percentile, and whiskers extend to the largest or smallest values within 1.5 × IQR from the hinges. P-values were calculated from n = 3 independent replicates using a two-tailed T-test. **p < 0.01 (p = 0.0095) (C) Representative images showing the localization of O. tsutsugamushi strain UT76 at 2 dpi in wild-type and GFP-ScaC HeLa ATCC CCL-2 cells. Scale bars indicate 10 μm. D Quantification of bacterial distance from the nucleus in wild-type and GFP-ScaC cell lines. The beeswarm and box plots are as described in (B). P-values were calculated from n = 3 independent replicates using a two-tailed T-test. **= p < 0.01 (p = 0.0012). E Representative images showing the localization of O. tsutsugamushi strain UT76 at 2 dpi in wild-type, BICD1−/−, BICD2−/− or BICD1−/−/BICD2−/− HeLa ATCC CCL-2 cells. Scale bars indicate 10 μm. F Quantifications of the bacterial distance from the nucleus in each cell line in (E). The beeswarm and box plots are as described in (B). P-values were calculated from n = 3 independent replicates using two-tailed ANOVA with a Tukey HSD pot-hoc test. *p < 0.05, ***p < 0.001. WT:BICD2−/− p = 0.011, WT:BICD1−/−/BICD2−/− p = 4.4 × 10-4, BICD2−/−:BICD1−/−/BICD2−/− p = 1.4 × 10-5.Source data are provided as a Source Data file.
Fig. 5
Fig. 5. Model of O. tsutsugamushi transport by ScaC and BICD adaptors.
(Top panel) Following vacuole escape, the intracellular bacterium O. tsutsugamushi undergoes microtubule- and dynein-based transport to reach its replicative niche at the perinucleus. (Bottom panel) We propose a model whereby the autotransporter protein ScaC, which sits on the bacterial outer membrane, recruits the activating adaptors BICD1 and BICD2 to the bacterial surface. We show that binding of ScaC to the C-terminus of BICD2 relieves the adaptor from autoinhibition, thus enabling it to form a complex with dynein and dynactin and initiate movement along microtubules.

References

    1. Haglund, C. M. & Welch, M. D. Pathogens and polymers: microbe-host interactions illuminate the cytoskeleton. J. Cell Biol.195, 7–17 (2011). - PMC - PubMed
    1. Kim, S. W. et al. Microtubule- and dynein-mediated movement of Orientia tsutsugamushi to the microtubule organizing center. Infect. Immun.69, 494–500 (2001). - PMC - PubMed
    1. Clausen, J. D., Christiansen, G., Holst, H. U. & Birkelund, S. Chlamydia trachomatis utilizes the host cell microtubule network during early events of infection. Mol. Microbiol.25, 441–449 (1997). - PubMed
    1. Grieshaber, S. S., Grieshaber, N. A. & Hackstadt, T. Chlamydia trachomatis uses host cell dynein to traffic to the microtubule-organizing center in a p50 dynamitin-independent process. J. Cell Sci.116, 3793–3802 (2003). - PubMed
    1. Salje, J. Orientia tsutsugamushi: a neglected but fascinating obligate intracellular bacterial pathogen. PLoS Pathog.13, e1006657 (2017). - PMC - PubMed

MeSH terms

LinkOut - more resources