. 2025 Jul 3;16(1):6112.
doi: 10.1038/s41467-025-60868-1.

MR-link-2: pleiotropy robust cis Mendelian randomization validated in three independent reference datasets of causality

Collaborators, Affiliations

MR-link-2: pleiotropy robust cis Mendelian randomization validated in three independent reference datasets of causality

Adriaan van der Graaf et al. Nat Commun. .

Abstract

Mendelian randomization (MR) identifies causal relationships from observational data but has increased Type 1 error rates (T1E) when genetic instruments are limited to a single associated region, a typical scenario for molecular exposures. We developed MR-link-2, which leverages summary statistics and linkage disequilibrium (LD) to estimate causal effects and pleiotropy in a single region. We compare MR-link-2 to other cis MR methods: i) In simulations, MR-link-2 has calibrated T1E and high power. ii) We reidentify metabolic reactions from three metabolic pathway references using four independent metabolite quantitative trait locus studies. MR-link-2 often (76%) outperforms other methods in area under the receiver operator characteristic curve (AUC) (up to 0.80). iii) For canonical causal relationships between complex traits, MR-link-2 has lower per-locus T1E (0.096 vs. min. 0.142, at 5% level), identifying all but one of the true causal links, reducing cross-locus causal effect heterogeneity to almost half. iv) Testing causal direction between blood cell compositions and marker gene expression shows MR-link-2 has superior AUC (0.82 vs. 0.68). Finally, analyzing causality between metabolites not directly connected by canonical reactions, only MR-link-2 identifies the causal relationship between pyruvate and citrate ( α ̂ = 0.11, P = 7.2⋅10-7), a key citric acid cycle reaction. Overall, MR-link-2 identifies pleiotropy-robust causality from summary statistics in single associated regions, making it well suited for applications to molecular phenotypes.


Conflict of interest statement

Competing interests: The main authors of this study do not declare a competing interest. The authors of the eQTLGen consortium declare the following competing interests: B.M.P. serves on the Steering Committee for the Yale Open Data Access Project funded by Johnson & Johnson. This activity is unrelated to this work. M.I. is a trustee of the Public Health Genomics (PHG) Foundation, a member of the Scientific Advisory Board of Open Targets, and has a research collaboration with AstraZeneca that is unrelated to this study. D.S.P. is an employee and stockholder of AstraZeneca. The other authors of the eQTLGen consortium do not declare competing interests.

Figures

Fig. 1
Fig. 1. Overview of this study: the assumptions underlying Mendelian randomization (MR), a graphical representation of MR-link-2 method and the four ways we benchmark and compare MR-link-2 to other cis MR methods.
a Directed acyclic graph to illustrate the assumptions underlying MR. Single nucleotide polymorphisms (SNPs) are used as instruments to estimate the causal effect between an exposure (X) and an outcome (Y) confounded by C. The blue, yellow and purple arrows highlight the assumptions underlying MR. Black arrows are allowed but are not necessary for correct inference. b Graphical representation of the MR-link-2 method. In contrast to other MR methods, MR-link-2 models all the SNPs in a genetic region to simultaneously estimate the (local) cis heritability of the exposure (IV-I, hX2, blue arrows), the total pleiotropic effects on the outcome due to violations of the exclusion restriction assumption (IV-III, hY2, purple arrows) and the causal effect α (green arrow) that is robust to violations of IV–III. MR-link-2 requires that linkage disequilibrium is measured in between the genetic variants (chain symbol). cf Validations done to compare MR-link-2 to other methods. (c) First validation is done using simulations. Shown here is a simulated genetic region where an exposure is causal to an outcome. The outcome also contains genetic effects independent of the exposure, which would violate the exclusion restriction (two-sided P values come from a univariable linear regression) (IV–III). d We perform a second comparison of cis MR methods using gold standard metabolite reactions present in curated metabolic networks. For illustration, we show here the human caffeine metabolism from WikiPathways. e Validation through canonical causal relationships between complex traits. Shown here, for illustration, is the well-known causal relationship between smoking and coronary artery disease. f Final validation tests the ability to decide between forward vs reverse causal effects. We utilize the genetics of blood cell proportions to predict their causal effect onto well-known blood cell marker genes. Null causal effects are defined as the reverse direction which should not be causal.
Fig. 2
Fig. 2. Simulations of MR-link-2 in different scenarios.
a Type I error rate of MR-link-2 in simulations with no causal effect (α=0) and various combinations of exposure genetic variance (σX2, which is a measure of IV–I) and outcome genetic variance (hY2, which violates the IV–III assumption of no pleiotropy). b Statistical power in the same simulation scenarios as panel (a) with a simulated causal effect (α=0.2). c The power to detect non-zero pleiotropy by MR-link-2 (testing the pleiotropy parameter hY2). The simulation settings are the same as in panel (a), however, here we do not test for a causal effect, rather we test for violations of the IV–III assumptions of no pleiotropy. dh The discriminative ability of MR-link-2 and other tested methods between simulations of no causal effect and those with a non-zero causal effect, characterized by the area under the receiver operator characteristic curve (AUC). The AUC values of MR-link-2 are compared to those of other competing methods. Here we also included additional simulation scenarios, where the infinitesimal exposure genetic model is violated (Methods). Parameter settings are only plotted for which both methods successfully estimate at least 750 / 1000 simulation instances in both null and non-null causal effect scenarios. Points are colored by the simulated pleiotropy parameter of hY2. The x-axis corresponds to methods as follows: d MR-IVW; e MR-IVW LD; f MR-PCA; g coloc; h coloc SuSIE. (Methods) (Supplementary Data 2) (i) A heatmap of (multivariable ordinary least squares) regression coefficients for each method when AUC is regressed on various model parameters. This allows identification of the impact of each simulation parameter on the AUC of each method. The simulated range of each parameter is shown in brackets. 1/nref: represents the precision of the linkage disequilibrium reference used in this study, i.e. the inverse of the reference panel size. min(rcausal) represents the minimum correlation between the causal SNPs and SNPs with direct effect on Y. mcausal/100 represents the number of causal SNPs selected in the region divided by 100 to ensure comparable regression coefficient scales (Methods).
Fig. 3
Fig. 3. Metabolite quantitative trait loci (mQTL) studies used in this analysis, an example MR analysis and the true causal links and true positives identified in this study.
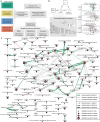
a Chart depicting the metabolites and their mQTLs used in this study. We utilized four mQTL studies whose studied metabolites were harmonized into 1035 consensus metabolites. To create ground truth causal links between these metabolites, we used three pathway definitions. Overlapping mQTL studies with the metabolite databases resulted in 266 metabolite measurements across studies. Metabolites can be measured in multiple studies, leading to 154 unique measured metabolites. In Mendelian randomization (MR), an exposure (a substrate in a reaction) needs to have at least one mQTL available, resulting in 193 (126 unique) metabolites with at least one SNP (P 5108). This is not a requirement when the metabolite is the outcome. b Example MR result for the reaction between leucine and 4-methyl-2-oxopentanoate (supported by three databases). Leucine has genetic associations in 3 out of 4 mQTL studies where it was measured. We use SNPs in the associated regions for leucine as instruments to estimate the causal effect of leucine on 4-methyl-2-oxopentanoate. For brevity, causal estimates are only shown when the outcome is measured in Shin et al. All regional causal estimates (round circles) can be meta-analyzed into a weighted estimate (large diamond) for a joint causal estimate. c The ground truth positive causal relationships between metabolites extracted from 3 databases, containing 287 reactions across 154 metabolites. Causal estimates outside the pathway definitions are not shown. The size of the nodes represents the number of measurements. Arrow width represents the occurrence of the reaction in the metabolic pathway definitions. The color denotes if a reaction was found or not. Green: The reaction was Bonferroni significant (P < 1.0 × 10−6) for MR-link-2 in at least one study combination when meta analyzing the estimates across the reaction (the weighted estimate from panel b). Grey: The reaction was not Bonferroni significant for MR-link-2. Pink: The substrate in the reaction does not have associated regions, meaning that there is no data for causal estimation.
Fig. 4
Fig. 4. Comparison of different cis MR methods through effect size analysis, the true and false causal link datasets used for a comparison of discriminative ability of the metabolites in this study.
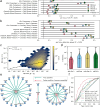
Causal effects are estimated for an exposure for each associated exposure region, testing single region results for each region. ad The causal effect estimates of the Mendelian randomization (MR) methods tested in this study, when comparing nominally significant (P0.05) estimates between a metabolite on itself using two different mQTL datasets, when they are not included in the true positive dataset. The mean (μ) of a self-estimate is expected to be 1.0. panels represent different methods: a MR-link-2 (79 comparisons), b MR-IVW (80 comparisons), c MR-IVW LD (82 comparisons) and (d) MR-PCA (80 comparisons). eh Distribution of Bonferroni significant (P2.1107) regional causal effect estimates. We report percentage positive effect size estimates, these likely represent direct metabolic reactions, as substrate to product reactions should have positive effect. e MR-link-2 (1242 combinations), f MR-IVW (3218 combinations), g MR-IVW (3373 combinations) and (h) MR-PCA (3229 combinations). i A Venn diagram representing the number of true causal link combinations used for the regional results in this study per pathway definition. True positives are metabolites (one for each associated exposure region) that are one reaction apart. j Negatives used in this study. We define the link between two metabolites as a negative when separated by at least m reactions in the full metabolite graphs created from the databases (combinations with more than 10 links). kp The area under the receiver operator characteristic curve (AUC) of cis-MR and colocalization methods benchmarked against different databases (km) and database combinations (np). Only considering comparisons with more than 10 negatives (same as panel j) per positive definition (same as panel i). When there is no SuSIE coloc estimate available for a region, the original coloc estimate is used. True causality and false causality: k from the KEGG pathway, l from the MetaCyc pathway, m from the WikiPathways pathway, n present in any pathway definition, o present in at least two pathway definitions, p shared in all pathways.
Fig. 5
Fig. 5. Analysis of different MR methods on canonical causality and the causality between blood cell traits.
a The per locus detection rate (at P < 0.05) for phenotype combinations that are not considered causal or are unlikely to be considered causal by Morrison et al. b The per locus detection rate (at P > 0.05) for phenotypes that are considered causal. c Pleiotropic estimates (h^Y, where h^YP < 0.05) (y-axis) compared to MR-IVW absolute regional (αr) estimate deviation from the meta-analyzed one (α¯) (x-axis). The r correlation coefficient is the Spearman correlation. The regression line is from linear regression n log10 transformed comparisons. Due to a large number of points in the plot, the points are shown as a density. d Violin plot of the heterogeneity statistics of 306 complex trait to complex trait comparisons for the MR methods tested in this study. Upon meta-analysis of all the pairwise phenotype combinations in (a) and (b), we plot the Q statistic for each method (log10 scale). The bars and whiskers in the plot refer to the minimum, median and maximum heterogeneity value. e Blood cell type and eQTL analysis results. MR-link-2 Bonferroni significant (P < 5.15104) causal links between cell type concentrations and the RNA expression of their respective marker genes (Supplementary Data 18). Green colored arrows indicate the cell type influences the RNA gene expression in blood causally. These are considered true causal links. The red arrows indicate an (incorrect) causal link between the gene expression and the blood cell type marker, indicating reverse causality. f Area under the receiver operator characteristic curve for the cell type directionality analysis for all MR methods tested in this study based on the reported P value of the method.

References

    1. Katan, M. Apoupoprotein E isoforms, serum cholesterol, and cancer. Lancet327, 507–508 (1986). - PubMed
    1. Smith, G. D. & Ebrahim, S. ‘Mendelian randomization’: can genetic epidemiology contribute to understanding environmental determinants of disease? Int J. Epidemiol.32, 1–22 (2003). - PubMed
    1. Ference, B. A. et al. Effect of long-term exposure to lower low-density lipoprotein cholesterol beginning early in life on the risk of coronary heart disease: a Mendelian randomization analysis. J. Am. Coll. Cardiol.60, 2631–2639 (2012). - PubMed
    1. Millwood, I. Y. et al. Conventional and genetic evidence on alcohol and vascular disease aetiology: a prospective study of 500 000 men and women in China. Lancet393, 1831–1842 (2019). - PMC - PubMed
    1. Kjeldsen, E. W., Nordestgaard, L. T. & Frikke-Schmidt, R. HDL cholesterol and non-cardiovascular disease: a narrative review. Int. J. Mol. Sci.22, 4547 (2021). - PMC - PubMed

LinkOut - more resources