. 2025 Jul 3;11(1):201.
doi: 10.1038/s41531-025-00967-4.

Insights into ancestral diversity in Parkinson's disease risk: a comparative assessment of polygenic risk scores

Collaborators, Affiliations

Insights into ancestral diversity in Parkinson's disease risk: a comparative assessment of polygenic risk scores

Paula Saffie-Awad et al. NPJ Parkinsons Dis. .

Abstract

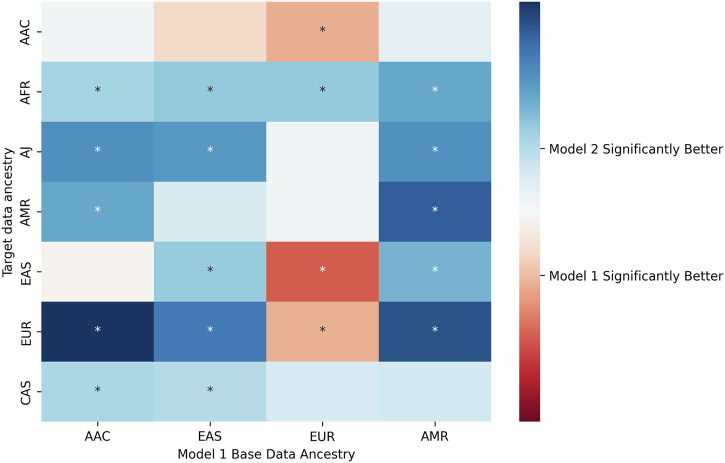
Risk prediction models play a crucial role in advancing healthcare by enabling early detection and supporting personalized medicine. Nonetheless, polygenic risk scores (PRS) for Parkinson's disease (PD) have not been extensively studied across diverse populations, contributing to health disparities. In this study, we constructed 105 PRS using individual-level data from seven ancestries and compared two different models. Model 1 was based on the cumulative effect of 90 known European PD risk variants, weighted by summary statistics from four independent ancestries (European, East Asian, Latino/Admixed American, and African/Admixed). Model 2 leveraged multi-ancestry summary statistics using a p-value thresholding approach to improve prediction across diverse populations. Our findings provide a comprehensive assessment of PRS performance across ancestries and highlight the limitations of a "one-size-fits-all" approach to genetic risk prediction. We observed variability in predictive performance between models, underscoring the need for larger sample sizes and ancestry-specific approaches to enhance accuracy. These results establish a foundation for future research aimed at improving generalizability in genetic risk prediction for PD.


Conflict of interest statement

Competing interests: M.A.N. and H.L.’s participation in this project was part of a competitive contract awarded to Data Tecnica International LLC by the National Institutes of Health to support open science research. M.A.N. also currently serves on the scientific advisory board for Character Bio Inc. and Neuron23 Inc. L.N.K. and K.H. are employed by and hold stock or stock options in 23andMe, Inc. A.S. serves as an Associate Editor for NPJ Parkinson’s Disease.

Figures

Fig. 1
Fig. 1. Schematic study workflow.
The study workflow is summarized in three panels. The first panel presents the individual-level datasets (target data) from seven diverse ancestry groups: African Admixed (AAC), African (AFR), Ashkenazi Jewish (AJ), Latino/Admixed American (AMR), Central Asian (CAS), East Asian (EAS), and European (EUR). The second panel compares the two implemented models: a Model 1 evaluates the cumulative effect of the 90 Parkinson’s disease (PD) risk variants identified by Nalls et al., across the target data, weighted by effect sizes from four population-specific summary statistics (base data) (EUR, AAC, AMR, EAS) and adjusted by principal components or percentage of ancestral admixture, leading to the generation of 56 scores; and b Model 2 implements a best-fit p-value thresholding PRS along with variant-specific weights based on the multi-ancestry summary statistics from Kim et al. (pruned using default parameters). This approach generated a total of 49 PRS. The third panel includes visualizations used to interpret results: heatmaps for ancestry comparison, density plots for disease probability, forest plots for effect size, and Receiver Operating Characteristic (ROC) plots to evaluate model sensitivity and specificity.
Fig. 2
Fig. 2. Upset plot showing risk heterogeneity across ancestries.
Case-control association analysis results for the 90 risk variants across ancestries. The Y-axis lists the ancestry populations — African Admixed (AAC), African (AFR), Ashkenazi Jewish (AJ), Latino/Admixed American (AMR), Central Asian (CAS), East Asian (EAS), and European (EUR)—while the X-axis shows the 90 risk variants. The color bar indicates the magnitude of effect as the log of the odds ratio (beta value) and its directionality, with red representing negative directionality and blue representing positive directionality, after standardizing the effect allele for each estimate. Note: the directionality of effect for variants with non-significant association p-values (>0.05) should be interpreted with caution and considered only as a potential trend. Variant p-values can be found in Supplementary Table 3. Empty slots represent variants that were not present in cases or controls within the corresponding ancestry.
Fig. 3
Fig. 3. Model 1 and Model 2 magnitude of effect for each cohort.
Forest plots comparing the effectiveness of risk prediction across the studied ancestries. Each panel contrasts individual-level data for the cohorts under study with the Model 1 population-specific summary statistics — European (EUR), East Asian (EAS), Latino/Admixed American (AMR), and African Admixed (AAC) — as well as the multi-ancestry data used in Model 2. The X-axis represents the magnitude of effect, while the Y-axis lists the summary statistics for each group. The dots symbolize the value of the beta coefficient, and the horizontal lines depict the 95% confidence intervals.
Fig. 4
Fig. 4. Model 2 performance for each cohort.
Receiver operating characteristic (ROC) curves evaluating the performance of Model 2. Each cohort is represented by a color-coded curve: African Admixed (AAC) in blue, African (AFR) in orange, Ashkenazi Jewish (AJ) in green, Latino/Admixed American (AMR) in red, East Asian (EAS) in purple, European (EUR) in brown, and Central Asian (CAS) in pink. The Y-axis represents the true positive rate (sensitivity), and the X-axis shows the false positive rate (1-specificity).
Fig. 5
Fig. 5. Comparison of polygenic risk score performance between Model 1 and Model 2.
Heatmap comparing the performance of the two models under study based on DeLong’s test. The X-axis represents the base data for Model 1 being compared against Model 2, with ancestry-specific summary statistics adjusted by principal components (PCs), while the Y-axis indicates the target data. The seven ancestry groups analyzed include African (AFR), Ashkenazi Jewish (AJ), Central Asian (CAS), African Admixed (AAC), Latino/Admixed American (AMR), East Asian (EAS), and European (EUR). The color scale represents the difference in AUC performance between the two models, ranging from red (Model 1 performs better) to blue (Model 2 performs better). Asterisks (*) indicate statistically significant differences (p < 0.05) in performance between the models.

Update of

References

    1. Nalls, M. A. et al. Identification of novel risk loci, causal insights, and heritable risk for Parkinson’s disease: a meta-analysis of genome-wide association studies. Lancet Neurol.18, 1091–1102 (2019). - PMC - PubMed
    1. Foo, J. N. et al. Identification of risk loci for Parkinson disease in asians and comparison of risk between Asians and Europeans: a genome-wide association study. JAMA Neurol.77, 746–754 (2020). - PMC - PubMed
    1. Loesch, D. P. et al. Characterizing the genetic architecture of Parkinson’s disease In Latinos. Ann. Neurol.90, 353–365 (2021). - PMC - PubMed
    1. Rizig, M. et al. Identification of genetic risk loci and causal insights associated with Parkinson's disease in African andAfrican admixed populations: a genome-wide association study. Lancet Neurol.11, 1015–1025 (2023). - PMC - PubMed
    1. Tan, A. H. et al. GP2: The Global Parkinson’s Genetics Program. Mov. Disord.36, 842–851 (2021). - PMC - PubMed

LinkOut - more resources