. 2025 Jul 4;16(1):6153.
doi: 10.1038/s41467-025-61486-7.

DDX1 methylation mediated MATR3 splicing regulates intervertebral disc degeneration by initiating chromatin reprogramming

Affiliations

DDX1 methylation mediated MATR3 splicing regulates intervertebral disc degeneration by initiating chromatin reprogramming

Dingchao Zhu et al. Nat Commun. .

Abstract

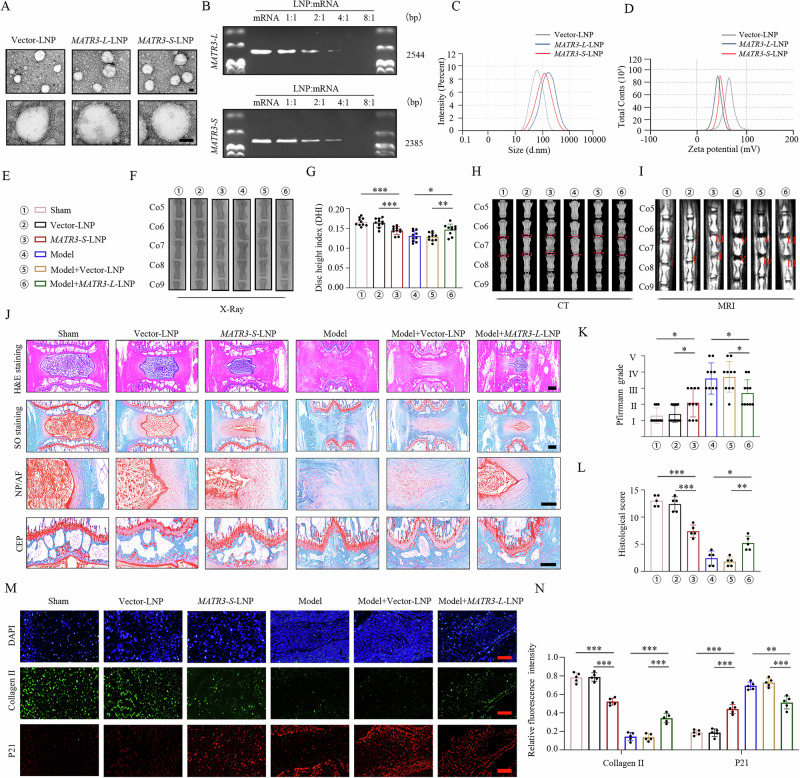
Low back pain (LBP), primarily driven by intervertebral disc degeneration (IVDD), has become a core challenge in public health. DDX1, an RNA-binding protein, plays key roles in RNA metabolism but its function in IVDD remains unclear. We identify DDX1 as a substrate of methyltransferase EZH2, which methylates DDX1 at lysine 234 (K234), promoting IVDD in vitro and in vivo. EZH2 inhibition restores matrix homeostasis in nucleus pulposus (NP) cells and slows IVDD progression. Methylation at DDX1 K234 disrupts its interaction with splicing factors and RNA targets, promoting exon 14 skipping in MATR3. This truncated MATR3 disrupts nuclear architecture, increases chromatin accessibility, and activates signaling pathways such as Wnt, leading to NP cell senescence and apoptosis. Notably, delivery of MATR3-L-overexpressing mRNA via cationic lipid nanoparticles reduces NP cell degeneration and significantly alleviates IVDD, offering important insights into IVDD pathogenesis and potential therapeutic strategies.


Conflict of interest statement

Competing interests: The authors declare no competing interests.

Figures

Fig. 1
Fig. 1. Mono-methylation of DDX1 lysine 234 in NP cells during IVDD.
A LC-MS/MS experimental workflow schematic. Cell lysates from degenerated and non-degenerated NP tissues were digested and applied to LC-MS/MS. B LC-MS/MS of the Lys234 residue of the peptide segment NQALFPACVLK, with a molecular weight of +14.016 Da. C, D Detection of endogenous DDX1 lysine methylation in NP and HEK-293T cells by CO-IP (n = 3). E IF analysis of collagen II and MMP3 expression (green: collagen II; red: MMP3; scale bar: 50μm). F Expression of endogenous DDX1 lysine methylation was detected by CO-IP in normal and TBHP-treated NP cells (n = 3). G CO-IP of the DDX1 K234 methylation (R2 was the R1 clone system, n = 3). H, J Schematic illustration showing the experiment design. Compared with the control group (n = 5), the rat IVDD model was established by needle puncture (model group, n = 20), LV-scrambled or LV-shDDX1 were used to knock down DDX1 in model group rats (scrambled group, n = 5 and shDDX1 group, n = 5). Subsequently, shRNA-resistant LV-DDX1 WT (DDX1 WT group, n = 5) and LV-DDX1 K234R (DDX1 K234R group, n = 5) were re-overexpressed in the shDDX1 group rat and injected weekly into the NP. I H&E and SO&FG of discs from rats. Scale bar: 1 mm. K–M X-ray K, CT L, MRI M of rat vertebrae (n = 5). N, O DHI N, Pfirrmann grades (O) of discs (n = 10). Data information: *P < 0.05, **P < 0.01, ***P < 0.001. Data are represented as mean ± SEM. P value was quantified by two-way ANOVA (N, O). Panels (C–G) show the results of a representative similar result from one of three independent experiments. Panels (I, K–M) the results of a representative similar result from one of five independent experiments.
Fig. 2
Fig. 2. DDX1 interacts with EZH2 physically and is methylated at its lysine 234 site.
A Chordal graph and B GO biological process enrichment showing differential abundance of DDX1-interacting lysine methyltransferase in HEK-293T cells transfected with DDX1 WT. C CO-IP of the lysine methylation of exogenous DDX1 in HEK-293T (n = 3). D Interaction analysis between exogenous DDX1 and lysine methyltransferase (n = 3). E Protein level analysis of EZH2, β-actin was used as the loading control (n = 3, P = 0.0055). F IF of EZH2 and DDX1 in NP cells. Scale bar: 10μm (n = 3). G IHC of the EZH2 in NP. Scale bar: 100μm (n = 3). H Association assessment between the EZH2 and Pfirrmann grades (n = 3, P < 0.0001). I mRNA analysis of EZH2 in NP cells by RT-PCR (n = 3, P = 0.0009, P = 0.0021). J, K Co-IP of endogenous EZH2 with anti DDX1 antibody J and endogenous DDX1 with anti EZH2 antibody (K) in NP cells (n = 3). L, M Affinity pulldown using 6×His-tagged DDX1 followed by IB with anti-His and anti-GST antibodies, as well as CO-IP, were performed in HEK-293T cells. The latter was used to assess the binding between exogenously expressed EZH2 and either WT or mutant (KR, KM) forms of DDX1 under overexpression conditions (n = 3). N CO-IP was carried out in HEK-293T cells transiently transfected with the indicated constructs to characterize the interaction profiles between DDX1 and EZH2 (n = 3). O, P To investigate the regulatory effect of EZH2 on the lysine methylation of DDX1 under oxidative stress, CO-IP were conducted in TBHP-treated NP cells. Comparisons were made between EZH2-knockdown and EZH2-overexpressing conditions to determine the functional relevance of EZH2-mediated PTM (n = 3). Q CO-IP of the methylation of WT and K234R DDX1 in HEK-293T transfected with Flag-EZH2 (n = 3). Data information: *P < 0.05, **P < 0.01, ***P < 0.001. Data are represented as mean ± SEM. P value was quantified by Student’s t-test (B, E, I) and two-way ANOVA (H). Panels (C–G, J–Q) show the results of a representative similar result from one of three independent experiments.
Fig. 3
Fig. 3. Activation of the EZH2-dependent DDX1 methylation pathway promotes IVDD.
A, B The siControl and siEZH2 plasmids were transfected into TBHP-treated NP cells, and the Collagen II (P < 0.0001) and MMP3 (P = 0.0022) was measured (n = 3). C, D Cells derived from NP/siEZH2 cells overexpressed with indicated DDX1-WT or DDX1-K234M were used to detect Collagen II (P = 0.0194) and MMP3 (P = 0.0208) expression by western blot (n = 3). E, I Illustration presenting the experiment design. The LV-scrambled or LV-shEZH2 were used to knock down EZH2 in needle puncture model rats (scrambled group, n = 5 and shEZH2 group, n = 15). Subsequently, LV-DDX1 WT (DDX1 WT group, n = 5) and LV-DDX1 K234M (DDX1 K234R group, n = 5) were overexpressed in the shEZH2 group rats and injected weekly into the NP. The duration was 4 weeks. FH X-ray F), CT (G), MRI results H) of rat vertebrae (n = 5). J, L-M) DHI (P < 0.0001, P = 0.0019), Pfirrmann grades (P = 0.0017, P = 0.0036) and histological points (P < 0.0001, P = 0.0001) of rat discs (n = 10). K HE and SO&FG of rat discs. Scale bar: 1 mm. N, O IHC of collagen II (P < 0.0001, P < 0.0001) and MMP3 (P < 0.0001, P = 0.0003) in rat discs. Scale bar: 150μm (n = 5). Data information: *P < 0.05, **P < 0.01, ***P < 0.001. Data are represented as mean ± SEM. P value was evaluated by Student’s t-test (B, D) and two-way ANOVA (J, L, M, O). Panels (A, C) show the results of a representative similar result from one of three independent experiments. Panels (F–H, K, N) show the results of a representative similar result from one of five independent experiments.
Fig. 4
Fig. 4. DDX1 methylation promotes cellular senescence and apoptosis in NP cells.
A Schematic workflow showing bulk RNA-seq of normal or TBHP-treated NP cells (n = 3), HEK-293T/siDDX1 cells infected with DDX1 K234M or DDX1 K234R (n = 3), and NP/siDDX1 cells infected with DDX1 K234M or DDX1 K234R (n = 3), which were used to identify DDX1 methylation mediated degeneration-associated phenotypes in NP cells. B GSEA of DEGs in normal and TBHP-treated NP cells. C GSEA of DEGs in HEK-293T/siDDX1 cells infected with DDX1 K234M or DDX1 K234R. D GO biological process enrichment analysis of transcriptome from HEK-293T/siDDX1 cells infected with DDX1 K234M or DDX1 K234R. E Heatmap representing senescence- and apoptosis-related genes determined by transcriptome in (Supplementary Data Fig. 2A). Twenty-nine genes were discovered to be significantly elevated in TBHP-treated cells were highlighted in orange (n = 3). F Heatmap representing senescence- and apoptosis-related genes determined by transcriptome in (Supplementary Data Fig. 2B). Twenty-five genes significantly elevated in K234M cells were highlighted in orange (n = 3). GH Apoptotic cells were detected by FC in G TBHP treated NP cells (n = 3) and H TBHP treated HEK-293T (n = 3), including early and late period. I SA-β-gal staining of NP cells. Scale bar: 100μm (n = 3). J Quantitative analysis of flow cytometry showing the apoptotic cells percentage of NP (P = 0.0001, P = 0.0010) and HEK-293T cells (P = 0.0006, P = 0.0002) with different indicated treatments (n = 3). Data information: *P < 0.05, **P < 0.01, ***P < 0.001. Data are represented as mean ± SEM. P value was evaluated by Student’s t-test (B–D) and two-way ANOVA (J). Panels (E, F, J) show the results of a representative similar result from one of three independent experiments.
Fig. 5
Fig. 5. Methylation leads to a decrease in transcriptome-wide DDX1 binding sites on RNA.
A, B PEAK distribution of gene functional regions of DDX1-binding transcripts in (A) normal and (B) TBHP-treated NP cells. C Distribution of DDX1-binding regions on genomic elements. D PEAK number analysis of RIP-Seq results of normal and TBHP-treated NP cells. E Heatmaps and line plots show the location of normal or methylated DDX1-enriched functional regions and the number of annotated human genes as indicated by cluster analysis. F Scatter plot of Control-RIP and TBHP-RIP read counts versus DDX1 binding regions. G Distribution of Control-RIP and TBHP-RIP reads across genes. H The intensity of RIP reads distributed around alternative exons. High-intensity exons (Control-RIP, blue) are included, and low-intensity exons (TBHP-RIP, deep blue) are excluded after methylation of DDX1. Randomly selected exons are used as controls (yellow). I, J, M GO analysis of DDX1-binding genes in Control-RIP and TBHP-RIP. K De novo motif analysis results of DDX1 RIP fragments, showing the top four enriched DDX1 binding sequence features. L Visualization concerned with localization of motifs 1 to 4 in the DDX1 binding region. N Comparison of the distribution differences between RIP reads and input in different genomic functional regions. O Analysis of the enrichment of DDX1 binding motifs in exonic regions and near intron-exon boundaries near the 5’splice site. To exclude the influence of different exon lengths, all exon intervals were normalized to 300 bp. P Statistical ranking analysis of the top four motifs bound by DDX1 based on the P calculated by HOMER. Statistical legend: *P < 0.05, **P < 0.01, ***P < 0.001. All data are expressed as mean ± SEM. Significant differences were evaluated by Student’s t test (I, J, M, P).
Fig. 6
Fig. 6. DDX1 promotes inclusion of MATR3 exon 14 by recruiting splicing factors.
A Schematic diagram showing different types of AS events. B Pie chart showing the composition ratio of each type of AS event in transcriptome of NP cells and HEK-293T cells. C Venn diagram showing the overlap of genes with SE events in the following four data sets: NP cells between Control and TBHP treatment groups (2542 genes), NP cells under K234R and K234M expression conditions (1266 genes), HEK-293T cells under K234R and K234M conditions (1077 genes), and 366 target genes directly bound by DDX1 identified in RIP-seq. D Combining RNA-seq and RIP-seq data, IGV was used to visualize the alternative splicing pattern of the MATR3 gene and the distribution of its DDX1 binding sites. E Sashimi plot concerned with SE of MATR3 exon 14 in TBHP-treated NP cells (blue), HEK-293T cells re-expressing K234M in the siDDX1 background (orange), and respective control cells (red or green). F Schematic diagram of the two transcript structures of MATR3: MATR3-L is the full-length form containing exon 14, and MATR3-S is the splicing variant lacking this exon. G Analysis of the changes in the expression ratio of MATR3-L/MATR3-S in NP cells (P = 0.0030) and HEK-293T cells (P = 0.0092), the results are based on three independent replicates (n = 3). H Semi-quantitative RT-PCR was used to verify the AS events of MATR3 in NP and HEK-293T cells under different treatments. I IP-MS was used to analyze the GO enrichment of associated proteins with DDX1 in HEK-293T cells. J Biological process enrichment in proteins from DDX1 proximal proteomes. K Correlation between the DDX1 enrichment ratios obtained via LC-MS from different HEK-293T cells transfected with DDX1 K234R or DDX1 K234M mutant. L, M Adjusted p values of (L) GO and (M) KEGG terms enriched in DDX1 proximal proteomes in HEK-293T cells with indicated treatment. Data information: *P < 0.05, **P < 0.01, ***P < 0.001. Data are represented as mean ± SEM. A significant P value was demonstrated by Student’s t-test (G, I, L, M). Panels (H) show the results of a representative similar result from one of three independent experiments.
Fig. 7
Fig. 7. MATR3 truncated isoform inhibits cellular senescence and apoptosis by maintaining chromatin accessibility.
A Histogram of all paired-end reads in the ATAC dataset of NP cells overexpressing MATR3-L or MATR3-S. B Bar graph showing differential ATAC-seq peak numbers in MATR3-L human NP cells versus MATR3-S human NP cells. C Visualization of the mean distribution of ChiPseeker annotations in MATR3-L human NP cells. D Heat map showing differential ATAC signal in MATR3-L human NP cells versus MATR3-S human NP cells. E Chromosome visualization of ATAC differentially accessible peaks for different MATR3 isoform changes. Each vertical line represents the corresponding dynamic ATAC-seq peak of different types of NP cells. F Volcano map shows the differentially accessible ATAC-seq peaks in MATR3-L human NP cells versus MATR3-S human NP cells. G Schematic diagram of the interaction network of Wnt signaling pathways based on GO annotations. H Heat map showing differential ATAC signal of CTNNB1 in MATR3-L human NP cells versus MATR3-S human NP cells. I GO analysis of up-regulated ATAC peak in MATR3-S human NP cells. J GO analysis of down-regulated ATAC peak in MATR3-S human NP cells. K Heatmaps showing the chromatin accessibility changes of differential peaks associated with the “Wnt signaling pathway” (left) and “MAPK signaling pathway” (right) in different MATR3 isoforms. Some representative genes associated with these differential peaks are annotated in the figure. L Violin plots quantify the ATAC-seq signal difference between MATR3-L and MATR3-S isoforms at the CTNNB1 locus in human nucleus pulposus cells (P = 0.032555). M, N Visualization of differential chromatin accessibility of the CTNNB1 gene region under different MATR3 isoform conditions from the chromosome level (M) and IGV browser view (N), respectively (FDR < 0.05). Data information: *P < 0.05, **P < 0.01, ***P < 0.001. All data are expressed as mean ± SEM, and statistical analysis was performed using Student’s t test (F, I, J, L).
Fig. 8
Fig. 8. LNPs-based MATR3-L-overexpressing mRNA cargo alleviates NP cells senescence and IVDD progression.
A TEM of LNPs loading with MATR3-L, MATR3-S or vector, Scale bar: 100 nm. B Gel retardation assay to determine the optimal ratio of LNP to mRNA. C, D NTA shows the size distribution (C) and zeta potential D of cationic LNPs/mRNA complexes. E, G DHI of rat coccygeal discs (n = 10, P = 0.0001, P = 0.0005, P = 0.0171, P = 0.0040). F, H, I X-ray F, CT H, MRI results (I) of rat discs (n = 5). J HE and SO&FG of rat discs. Scale bar: 1 mm. K, L Pfirrmann degenerative grades (P = 0.0209, P = 0.0429, P = 0.0377, P = 0.0215) and histological score (P < 0.0001, P = 0.0002, P = 0.0101, P = 0.0011) of rat coccygeal discs (n = 10). M, N IF (Scale bar: 500μm) staining of collagen II (P < 0.0001, P < 0.0001, P = 0.0001, P < 0.0001) and P21 (P < 0.0001, P < 0.0001, P = 0.0010, P = 0.0004) in rat coccygeal discs (n = 5). Data information: *P < 0.05, **P < 0.01, ***P < 0.001. Data are represented as mean ± SEM. P value was demonstrated by two-way ANOVA (G, K, L, N). Panels (A, B) show the results of a representative similar result from one of three independent experiments. Panels (F, H-J, M) show the results of a representative similar result from one of five independent experiments.
Fig. 9
Fig. 9. Schematic diagram illustrating the mechanism by which DDX1 lysine methylation mediates MATR3 alternative splicing to regulate IVDD.
In degenerated NP cells, upregulated EZH2 enhances the methylation of lysine 234 in DDX1. Methylated DDX1 interacts less with MATR3, leading to reduced enrichment of splicing factors at splicing sites and consequently promoting the generation of MATR3-S through exon 14 skipping. MATR3-S promotes excessive opening of chromatin accessibility, thereby aberrantly activating Wnt signaling pathways to promote NP cells aging and apoptosis. Additionally, a strategy based on cationic LNPs for delivering mRNA cargo overexpressing MATR3-L effectively alleviates the progression of IVDD.

References

    1. Knezevic, N. N., Candido, K. D., Vlaeyen, J. W., Van Zundert, S. J. & Cohen, S. P. Low back pain. Lancet398, 78–92 (2021). - PubMed
    1. Weifeng, Z. et al. Self-powered triboelectric-responsive microneedles with controllable release of optogenetically engineered extracellular vesicles for intervertebral disc degeneration repair. Nat. Commun.15, 5736 (2024). - PMC - PubMed
    1. Tang, S., Stokasimov, E., Cui, Y. & Pellman, D. Breakage of cytoplasmic chromosomes by pathological DNA base excision repair. Nature606, 930–936 (2022). - PMC - PubMed
    1. Silagi, E., Schipani, E., Shapiro, I. & Risbud, M. The role of HIF proteins in maintaining the metabolic health of the intervertebral disc. Nat. Rev. Rheumatol.17, 426–439 (2021). - PMC - PubMed
    1. Zhu, J. et al. CRLF1/CLCF1 heterodimer involvement in intervertebral disc degeneration via exacerbation of extracellular matrix degradation and nucleus pulposus cell senescence. Osteoarthr. Cartil.33, 574–589 (2025). - PubMed

MeSH terms

LinkOut - more resources