. 2025 Jul 3;8(1):992.
doi: 10.1038/s42003-025-08413-0.

Cancer cell type-specific derepression of transposable elements by inhibition of chromatin modifier enzymes

Affiliations

Cancer cell type-specific derepression of transposable elements by inhibition of chromatin modifier enzymes

Divyesh Patel et al. Commun Biol. .

Abstract

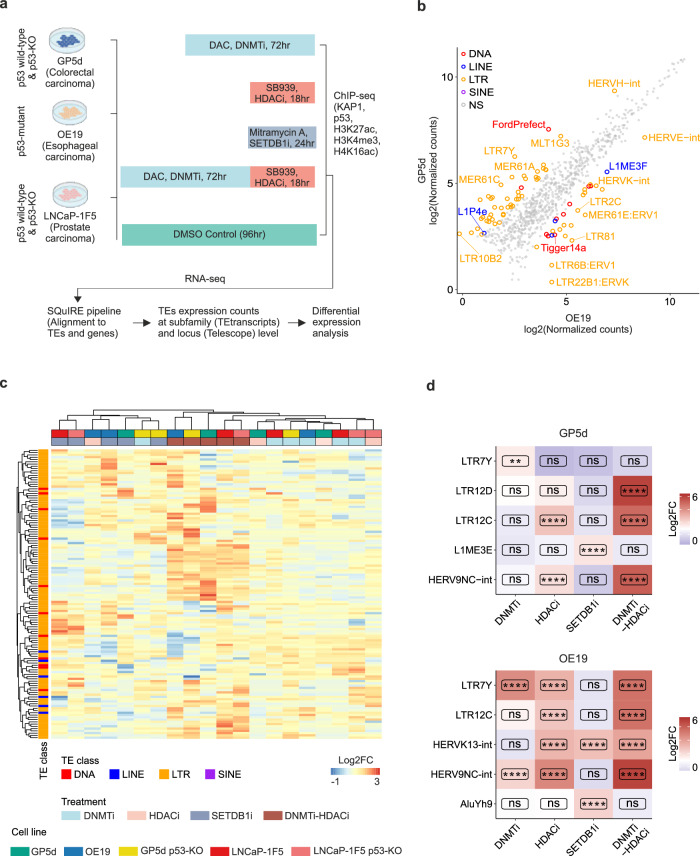
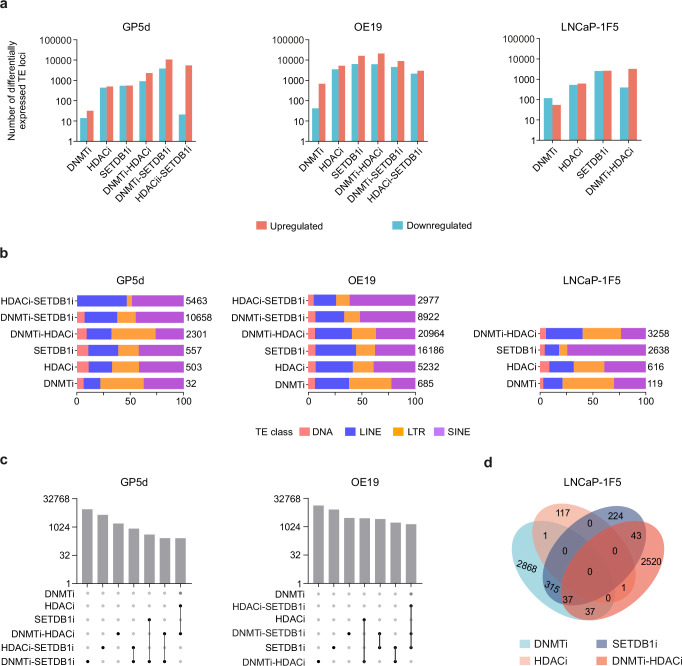
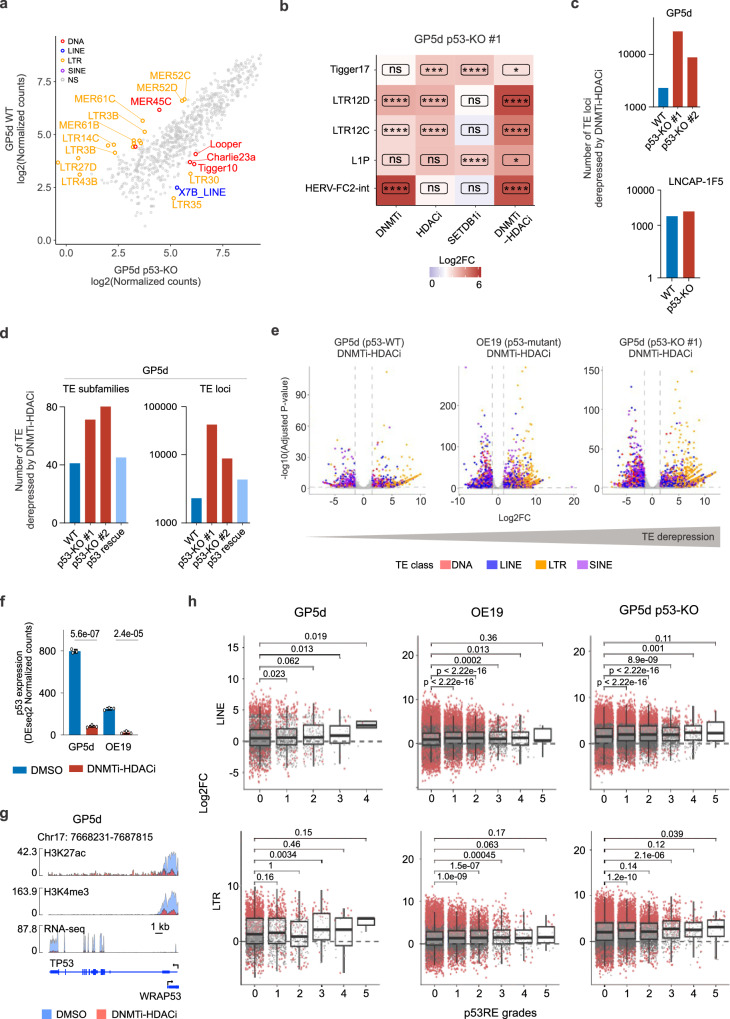
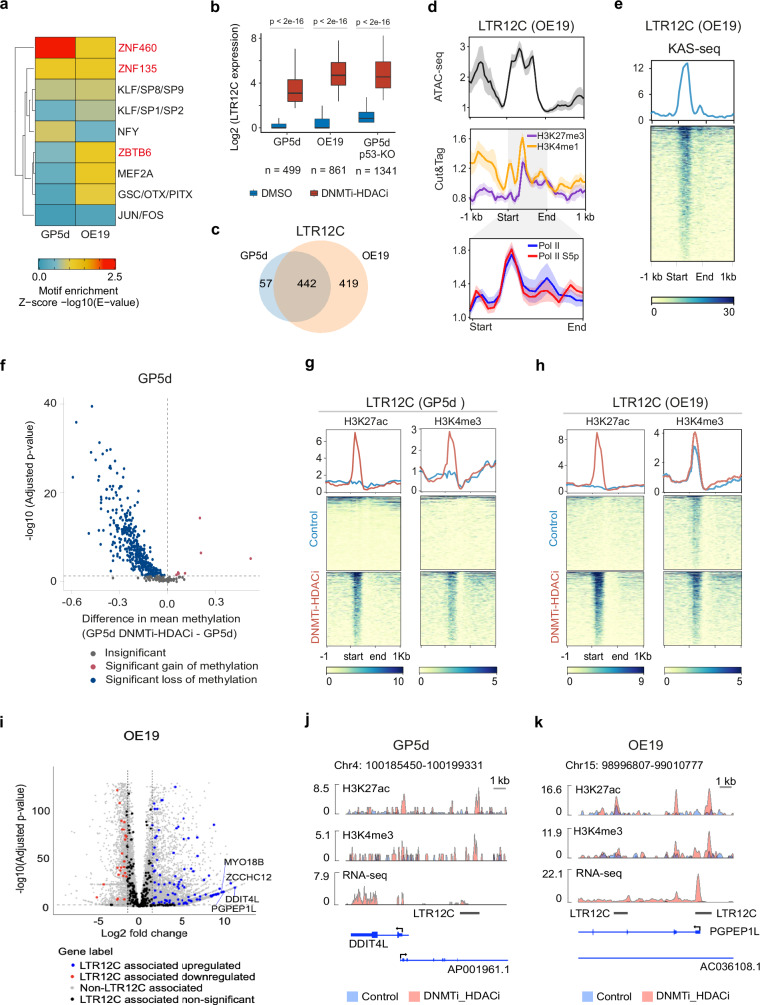
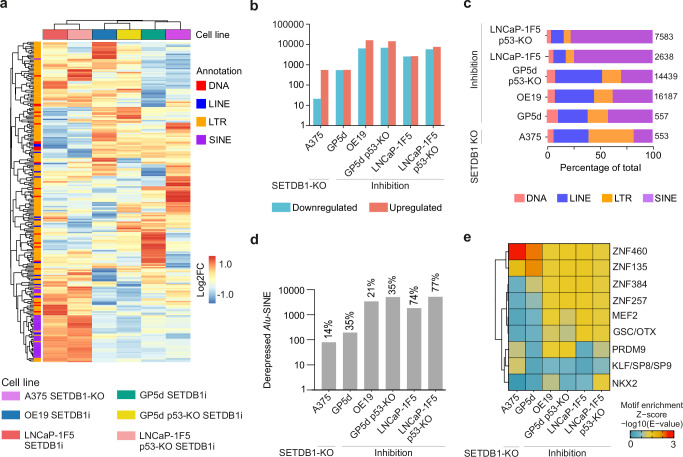
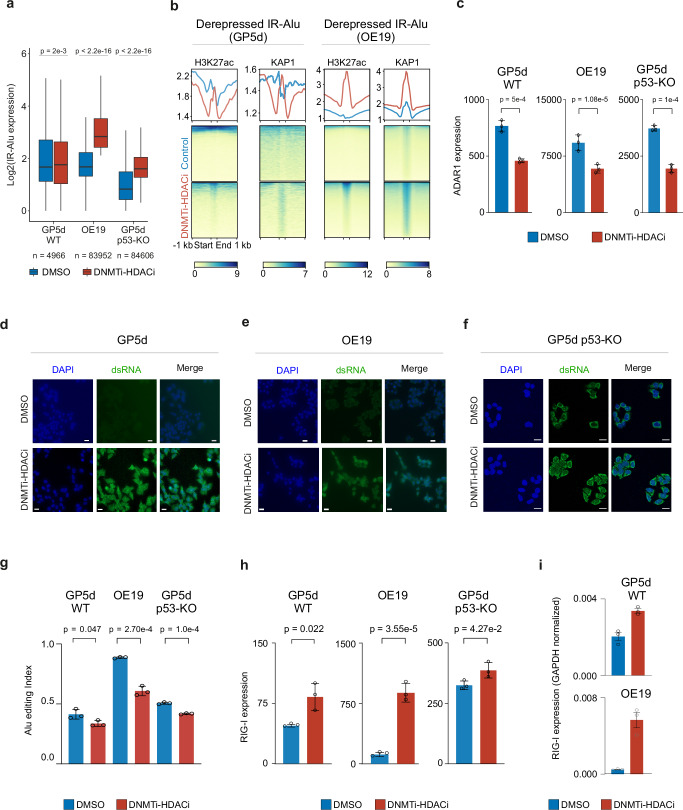
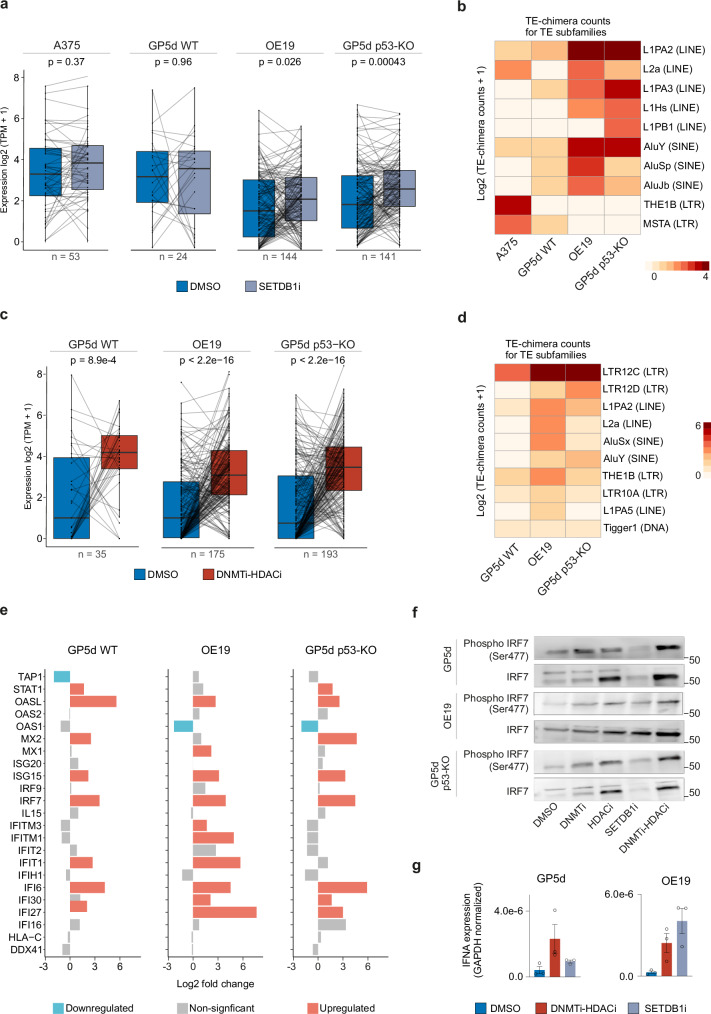
Derepression of transposable elements (TE) by epigenetic therapy leads to the activation of immune response in cancer cells. However, the molecular mechanism of TE regulation by distinct chromatin modifier enzymes (CME) in context of p53 is still elusive. Here, we used FDA-approved epigenetic drugs to systematically inhibit distinct CMEs in p53 wild-type and p53-mutant colorectal, esophageal, and prostate cancer cells. We show that distinct TE subfamilies are derepressed by inhibition of different CMEs in cell type-specific manner. Co-inhibition of DNMT and HDAC (DNMTi-HDACi) had the most consistent effect across cancer types. Loss of p53 results in stronger TE activation and TE-chimeric transcript expression and this effect is largely mediated by the non-genomic actions of p53. Robust immune response elicited by DNMTi-HDACi is due to induced inverted repeat Alu expression concomitant with reduced ADAR1-mediated Alu RNA editing. Collectively, our systematic analyses provide insights for rational use of epigenetic therapies in distinct cancers.


Conflict of interest statement

Competing interests: The authors declare no competing interests.

Figures

Fig. 1
Fig. 1. Common and cell type-specific TE subfamilies derepressed by inhibition of CMEs.
a Schematic representation of the CME inhibitor treatments and the analysis pipeline. All five cell lines were treated with DNMTi, HDACi, SETDB1i and DNMTi-HDACi. Additionally, GP5d and OE19 cells were treated with DNMTi-SETDB1i and HDACi-SETDB1i. Decitabine (DAC) DNMT inhibitor, SB939 HDAC inhibitor, and Mitramycin A SETDB1 inhibitor. b Differentially expressed TE subfamilies between DMSO-treated GP5d and OE19 cells. Scatter plot shows normalized RNA-seq read counts for TE subfamilies. Differentially expressed TE subfamilies are labeled by TE class. c Comparison of differentially expressed TE subfamilies induced by CMEi in the five cell lines. Differential expression analysis was performed by DESeq2. The heatmap shows log2 fold change (FC) for TE subfamilies with absolute log2FC > 2.5 (treatment vs. vehicle-treated cells from the same cell line) and adjusted p < 0.05 in at least one CME treatment in at least one cell lines. Rows and columns are clustered with hierarchical clustering. d Distinct TE subfamilies derepressed by CMEi in GP5d and OE19 cells. Expression changes for TE subfamilies (log2FC) were compared between different CME treatments in GP5d and OE19 cells. Significance symbols: **** indicates p < 0.0001, ***p < 0.001, **p < 0.01, *p < 0.05, ns = non-significant |log2FC| < 1.5 or p > 0.05. Source data are provided as Supplementary Data 11.
Fig. 2
Fig. 2. DNMT and HDAC co-inhibition synergistically derepresses TEs.
a Number of differentially expressed TE loci induced by CMEi in GP5d, OE19 and LNCaP-1F5 cells. TE loci that meet the threshold criteria of log2FC > 1.5 and adjusted p < 0.05 compared to vehicle-treated cells are considered as differentially expressed (DESeq2). b The proportion of derepressed TE loci by CMEi belonging to major TE classes in GP5d, OE19, and LNCaP-1F5 cells. Derepressed TE loci were labeled by TE class and their counts presented as percentage of total. Numbers represent total derepressed TE loci. c Top seven intersecting sets of derepressed individual TE loci from six different CMEi in GP5d and OE19 cells. The bar plot shows the number of derepressed TE loci and the matrix below the bar plot indicates CME inhibition represented by each bar. d Overlap of derepressed individual TE loci by CMEi in LNCaP-1F5 cells. Source data are provided as Supplementary Data 11.
Fig. 3
Fig. 3. Loss of p53 is associated with a stronger derepression of TEs by DNMT and HDAC co-inhibition.
a Differentially expressed TE subfamilies between GP5d and p53-KO GP5d cells. Scatter plot shows normalized RNA-seq read counts for TE subfamilies. Differentially expressed TE subfamilies are labeled by TE class. b Distinct TE subfamilies derepressed by CMEi in GP5d p53-KO cells. Expression changes for TE subfamilies (log2FC) were compared between different CME treatments in GP5d p53-KO cells. Significance symbols: **** indicates p < 0.0001, ***p < 0.001, **p < 0.01, *p < 0.05, ns = non-significant |log2FC| < 1.5 or p > 0.05. c Loss of p53 is associated with stronger derepression of TEs by DNMTi-HDACi. Bar plots compare (i) the number of derepressed TE loci by DNMTi-HDACi in WT GP5d and two independent p53-KO clones and (ii) the number of derepressed TEs loci between LNCAP-1F5 p53-WT and p53-KO cells. d Rescue experiments showing that p53 reintroduction is associated with weaker derepression of TEs at the subfamily and locus levels by DNMTi-HDACi. Bar plot comparing the number of derepressed TE subfamilies and TE loci by DNMTi-HDACi in GP5d, GP5d p53-KO clones #1 and #2 and p53-transfected GP5d p53-KO clone #1. e Volcano plots showing the differentially expressed individual TE loci by DNMTi-HDACi in GP5d, OE19, and GP5d p53- KO cells. f Bar plot comparing p53 expression in GP5d and OE19 cells treated with DNMTi-HDACi vs. DMSO control (unpaired two-sided t-test). g Genome browser snapshot of the TP53 gene locus showing the ChIP-seq signals for H3K27ac and H3K4me3 and an RNA-seq signal track for both DMSO control and DNMTi-HDACi-treated GP5d cells. h Comparison of TE expression changes induced by DNMTi-HDACi treatment between TEs harboring p53REs with different strengths. Expressed TEs with p53REs were stratified into five grades from least to most likely p53REs with transactivation potential using p53retriever. Boxplots show the number of up- and downregulated TE loci upon DNMTi-HDACi for each grade, significantly differentially expressed loci are marked with red (Adjusted p < 0.05, |log2FC| > 1). Comparisons between grades were performed with one-sided Wilcoxon tests. Number of LINEs and LTRs loci for each grade are shown in Supplementary Data 4. Source data are provided as Supplementary Data 11.
Fig. 4
Fig. 4. Distinct epigenetic mechanisms govern the derepression of LTR12C by co-inhibition of DNMT and HDAC.
a TF motif enrichment at TE sequences derepressed by DNMTi-HDACi in GP5d and OE19 cells. After performing motif enrichment analysis for individual motifs, similar motifs were combined into motif clusters from ref. . The representative TF clusters are labeled on the right. The minimum E-value found for an individual TF for each motif cluster was plotted in the final figure. b Boxplots comparing the expression of derepressed LTR12C in DMSO and DNMTi-HDACi GP5d, OE19 and GP5d-p53-KO cells (two-sided Wilcoxon paired test). The lower and upper hinges of the boxes represent the 25th to 75th percentiles, the midline is the median, and the whiskers extend from the hinges to the minimum and maximum values by 1.5 * interquartile range (IQR). c, Venn diagram showing the overlap between LTR12Cs derepressed by DNMTi-HDACi in GP5d and OE19 (shown in Fig. 4b). d Metaplots of ATAC-seq and CUT&TAG for H3K27me3, H3K4me1, RNAPII and Ser5p-RNAPII at derepressed LTR12Cs in DNMTi-HDACi OE19 cells (shown in Fig. 4b). Derepressed LTR12C elements show a poised chromatin state in OE19 cells, whereas LTR12C in GP5d cells were enriched with repressive H3K27me3 marks (see Supplementary Fig. 7b). e Heatmap showing the KAS-seq signal at derepressed LTR12C elements in DNMTi-HDACi OE19 cells (shown in Fig. 4b). f Volcano plot of nanopore sequencing data comparing CpG methylation levels at derepressed LTR12C elements (n = 499) in control and DNMTi-HDACi GP5d cells (shown in Fig. 4b). Significance was determined with a one-sided Fisher’s exact test. P-values were corrected with Benjamini-Hochberg method. g Heatmaps showing the ChIP-seq signals for H3K27ac and H3K4me3 in control and DNMTi-HDACi GP5d cells (shown in Fig. 4b). h Heatmaps showing the ChIP-seq signals for H3K27ac and H3K4me3 in control and DNMTi-HDACi OE19 cells (shown in Fig. 4b). i Derepressed LTR12C elements in DNMTi-HDACi GP5d and OE19 cells. Volcano plots show the changes in gene expression for derepressed LTR12C-associated genes for OE19 cells. Analysis of differentially expressed genes in OE19 cells with DNMTi-HDACi revealed significant upregulation of genes in the vicinity of derepressed LTR12C elements (±50 kb). In total, 102 out of 132 and 70 out of 89 differentially expressed genes were upregulated in GP5d and OE19 cells, respectively. j Genome browser snapshot of a derepressed LTR12C in control and DNMTi-HDACi GP5d cells. Panels show the ChIP-seq signals for H3K27ac, H3K4me3, and an RNA-seq signal track. k Genome browser snapshot of a derepressed LTR12C in control and DNMTi-HDACi OE19 cells. Each panel shows the ChIP-seq signals for H3K27ac, H3K4me3 and an RNA-seq signal track. Source data are provided as Supplementary Data 11.
Fig. 5
Fig. 5. Cell type-specific TEs derepressed by SETDB1 inhibition in cancer cell lines.
a Comparison of SETDB1 KO/inhibition-induced changes in the expression of TE subfamilies between six different cell lines. Differential expression analysis of RNA-seq data was performed with DESeq2. All TE subfamilies with absolute log2FC > 1.5 (treatment vs DMSO or A375 KO vs A375) and adjusted p < 0.05 in at least one CMEi treatment in one cell line were selected and their expression changes in log2FC was plotted. Rows and columns are clustered with hierarchical clustering. b Number of differentially expressed TE loci by SETDB1 KO/inhibition in A375, WT and p53-KO GP5d, OE19, and WT and p53-KO LNCaP-1F5 cells. c The proportion of TEs derepressed by SETDB1 KO/inhibition belonging to the major TE classes among the derepressed TEs by in A375, WT and p53-KO GP5d, OE19, and WT and p53-KO LNCaP-1F5 cells. d Number of Alu SINEs derepressed by SETDB1 KO/inhibition in A375, WT and p53-KO GP5d, OE19, and WT and p53-KO LNCaP-1F5 cells. Number above the bar represents the percentage of Alu SINEs in total derepressed TEs. e Motif enrichment analysis for TEs derepressed by SETDB1 KO/inhibition in A375, WT and p53-KO GP5d, OE19, and WT and p53-KO LNCaP-1F5 cells. The analysis was performed as described in Fig. 4a. Source data are provided as Supplementary Data 11.
Fig. 6
Fig. 6. Inverted repeat Alu SINEs are derepressed by co-inhibition of DNMT and HDAC in GP5d and OE19 cells.
a Boxplots showing a comparison of expression of transcriptionally active IR-Alu SINEs (total sum of RNA-seq reads for DMSO and DNMTi-HDACi ≥ 5, see “Methods” for details) in DMSO and DNMTi-HDACi GP5d, OE19, and GP5d p53-KO cells. Majority of IR-Alu SINEs are derepressed by DNMTi-HDACi (two-sided Wilcoxon paired test). The lower and upper hinges of the boxes represent the 25th to 75th percentiles, the midline is the median, and the whiskers extend from the hinges to the minimum and maximum values by 1.5 * IQR. b Heatmap showing the ChIP-seq signal for H3K27ac at IR-Alu SINEs in DMSO and DNMTi-HDACi GP5d and OE19 cells. c Comparison of normalized RNA-seq read counts for ADAR1 gene in DMSO and DNMTi-HDACi GP5d, OE19, and GP5d p53-KO cells. The graph shows mean ± SD values for three biological replicates (two-sided unpaired t-test). d Microscopy images for GP5d cells treated with DMSO or DNMTi-HDACi. DNA was stained with DAPI (blue), and dsRNA was stained using the J2 antibody (green). All scale bars are 20 μm. Cytoplasmic levels of dsRNA increased in DNMTi-HDACi treated GP5d cells as compared to the DMSO. e Microscopy images for dsRNA staining in OE19 cells treated with DMSO or DNMTi-HDACi, as shown in Fig. 6d. f Microscopy images for dsRNA staining in GP5d p53-KO cells treated with DMSO or DNMTi-HDACi, as shown in Fig. 6d. g Alu editing index (AEI) was calculated by using RNAeditingIndexer tool on RNA-seq data. Bar plots showing AEI for DMSO and DNMTi-HDACi GP5d, OE19, and GP5d p53-KO cells. The graph shows mean ± SD values for three biological replicates (two-sided unpaired t-test). h Bar plots comparing RIG1 gene expression in DMSO and DNMTi-HDACi GP5d, OE19, and GP5d p53-KO cells. The graph shows mean ± SD values for three biological replicates (two-sided unpaired t-test). i qRT-PCR data showing RIG-I mRNA expression in GP5d and OE19 cells treated with DMSO and DNMTi-HDACi (GAPDH normalized). The graph shows mean ± SD values for three biological replicates. Source data are provided as Supplementary Data 11.
Fig. 7
Fig. 7. SETDB1i and DNMTi-HDACi increases TE-chimeric transcript expression and activates inflammatory response.
a SETDB1i/KO increases the expression of TE-chimeric transcripts. Boxplots show the expression of TE-chimeric transcripts in A375, GP5d, OE19, and GP5d p53-KO cells with and without SETDB1i/KO. Expression of TE-chimeric transcripts was analyzed with the TEprof2 pipeline. P-values were calculated with a two-sided Wilcoxon test (n = 53, 24, 144, and 141 differentially expressed TE-chimeric transcripts in A375, GP5d, GP5d p53-KO, and OE19, respectively). The lower and upper hinges of the boxes represent the 25th to 75th percentiles, the midline is the median, and the whiskers extend from the hinges to the minimum and maximum values by 1.5 * IQR. b Analysis of TE subfamilies from which the TE-chimeric transcripts are derived from upon SETDB1i/KO. The counts for TE-chimeric transcripts are log2-transformed. c DNMTi-HDACi increases the expression of TE-chimeric transcripts. Boxplots show the expression of TE-chimeric transcripts in DMSO and DNMTi-HDACi GP5d, GP5d p53-KO, and OE19 cells. P-values were calculated with a two-sided Wilcoxon test (n = 35, 175, and 193 for GP5d, OE19, and GP5d p53-KO cells, respectively). The boxplot features are as in Fig. 7a. d Cell type-specific expression of TE subfamilies forming TE-chimeric transcripts by DNMTi-HDACi in cancer cell lines. The counts for TE-chimeric transcripts are log2-transformed. e ISGs are upregulated by DNMTi-HDACi. ISG log2FCs are plotted for DNMTi-HDACi treated GP5d, OE19 and GP5d p53-KO cells. f SETDB1i and DNMTi-HDACi increased levels of Serine 477 phosphorylated IRF7. Western blot compares Ser477-phospho-IRF7 and total IRF7 protein levels in GP5d, OE19 and GP5d p53-KO cells treated with different CME inhibitors. g qRT-PCR data showing IFNα mRNA expression in GP5d and OE19 cells treated with DMSO, DNMTi-HDACi, and SETDB1i (GAPDH normalized). ISGs are upregulated by DNMTi-HDACi and SETDB1i in GP5d and OE19 cells. The graph shows mean ± SD values for three biological replicates. Source data are provided as Supplementary Data 11.

Similar articles

References

    1. Wells, J. N. & Feschotte, C. A field guide to eukaryotic transposable elements. Annu. Rev. Genet.54, 539–561 (2020). - PMC - PubMed
    1. Burns, K. H. Transposable elements in cancer. Nat. Rev. Cancer17, 415–424 (2017). - PubMed
    1. Fueyo, R., Judd, J., Feschotte, C. & Wysocka, J. Roles of transposable elements in the regulation of mammalian transcription. Nat. Rev. Mol. Cell Biol.23, 481–497 (2022). - PMC - PubMed
    1. Chuong, E. B., Elde, N. C. & Feschotte, C. Regulatory activities of transposable elements: from conflicts to benefits. Nat. Rev. Genet.18, 71–86 (2017). - PMC - PubMed
    1. Karttunen, K. et al. Transposable elements as tissue-specific enhancers in cancers of endodermal lineage. Nat. Commun.14, 5313 (2023). - PMC - PubMed

MeSH terms