. 2025 Nov;21(11):1754-1761.
doi: 10.1038/s41589-025-01942-z. Epub 2025 Jul 3.

SNAP-tag2 for faster and brighter protein labeling

Affiliations

SNAP-tag2 for faster and brighter protein labeling

Stefanie Kühn et al. Nat Chem Biol. 2025 Nov.

Abstract

SNAP-tag is a powerful tool for labeling proteins with synthetic fluorophores in bioimaging. However, its utility in live-cell applications can be constrained by its relatively slow labeling kinetics and the limited cell permeability of its substrates. Here, we introduce improved labeling substrates and an engineered SNAP-tag for faster labeling in vitro and in live cells. SNAP-tag2 presents a second-order rate constant with rhodamine substrates that approaches 107 s-1 M-1, a 100-fold improvement over the corresponding SNAP-tag-substrate pairs. When labeled with highly fluorogenic dyes, SNAP-tag2 also shows a fivefold increase in fluorescence brightness relative to currently used SNAP-tag. The increased labeling kinetics and brightness of SNAP-tag2 translate into greatly improved performance in various live-cell (super-resolution) imaging applications.


Conflict of interest statement

Competing interests: V.N., S.K., J.H. and K.J. are listed as inventors on a patent application (EP 24172286) on improved SNAP-tag substrates filed by the Max Planck Society. The remaining authors declare no competing interests.

Figures
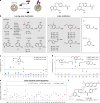
Fig. 1
Fig. 1. SNAP-tag substrate screening for more efficient labeling in vitro and in live mammalian cells.
a, Scheme of SNAP-tag labeling reaction with fluorophore substrates. The chemical structures of SNAP-tag substrates BG and CP are shown on the right. R represents the functional moiety to be linked to SNAP-tag. b, Chemical structures of modified SNAP-tag substrates divided into two groups: leaving group modification and linker modification. Modified leaving groups were linked to TMR over linker R1. Modified linkers coupled to TMR were tested on the CP (R2) scaffold. c,d, Comparison of substrates 117 (c) and substrates 1829 (d) relative to SNAP(f)-tag labeling with CP–TMR regarding their in vitro labeling kinetics and performance in live-cell labeling. In vitro labeling kinetics of SNAPf-tag with different substrates were measured recording FP traces over time. The kapp was calculated (Supplementary Table 1) and normalized to the kapp of SNAPf-tag with CP–TMR. Live-cell performance of developed substrates was tested by labeling of U2OS cells stably expressing an mEGFP–SNAP-tag fusion protein with TMR substrates at 100 nM for 2 h. Cells were washed and analyzed by flow cytometry. Fluorescence intensity ratios of TMR to mEGFP were calculated (Supplementary Table 1) and normalized to the ratio obtained for SNAP-tag with CP–TMR. Leaving group substrate 4 and linker substrates 22, 23 and 24 showed the most promising results relative to CP–TMR. e, Reactivity of selected SNAP-tag substrates with hAGT and CLIP(f)-tag compared to SNAP(f)-tag labeling with CP–TMR. Experiments were conducted as previously described. f, Chemical structure of TF–TMR (30) found through the combination of leaving group 4 and linker 22. The kapp of SNAPf-tag labeling with TF–TMR is depicted below.
Fig. 2
Fig. 2. SNAP-tag engineering aiming for faster and brighter fluorescence labeling.
a, Crystal structure of SNAP-tag labeled with TMR (PDB 6Y8P) with engineered regions highlighted. SNAP-tag is represented as a light-gray cartoon and the TMR ligand is represented as sticks. Saturation mutagenesis libraries were constructed on the C-terminal loop region (residues 155–161) and the β-strand proximal to the active site (residues 29–36), highlighted in blue and violet, respectively. Substitutions predicted by PROSS to increase the protein thermal stability are highlighted as green spheres. The unstructured region in SNAP-tag (residues 37–55) highlighted as a gray dotted line was redesigned using RosettaRemodel. Termini are highlighted in blue (N terminus) and red (C terminus) and the coordinated zinc ion is illustrated as a light-blue sphere. b, AlphaFold 2 (ref. ) model of SNAP-tag2. Introduced substitutions are highlighted as sticks and color-coded on the basis of the engineering rationale. Green, PROSS prediction; marine blue and deep purple, saturation mutagenesis libraries; wheat, rational design; teal, sDMSL; dark gray, Rosetta-modeled loop. Termini are highlighted in blue (N terminus) and red (C terminus). c, Sequence alignment of hAGT, SNAPf-tag and SNAP-tag2. Dark blue, common differences of SNAPf-tag and SNAP-tag2 versus hAGT; turquoise, unique differences SNAPf-tag versus hAGT; pink, unique differences SNAP-tag2 versus hAGT and/or SNAPf-tag. Amino acid deletions are presented as dotted lines. d, Comparison of labeling kinetics between SNAP-tag2 and SNAP-tag. The kapp of SNAP-tag2 with TF substrates demonstrate one to two orders of magnitude faster labeling kinetics compared to the reaction of parental SNAP-tag with CP substrates. Labeling kinetics of SNAP-tag2 with BG substrates remained unchanged compared to SNAP-tag labeling. CP and BG results for SNAP-tag labeling were taken from Wilhelm et al.. Abbreviations: Ac, acetate; BCN, biscyclononyne; Nor, (1S,4S)-5-methylbicyclo[2.2.1]hept-2-ene (norbornene); PhN3, phenylazide. e, Normalized absorbance spectra of fluorogenic CF3P–MaP618 and TF–MaP618 substrates (15 µM) in the presence or absence of SNAP-tag2/SNAPf-tag protein (30 µM). Fold changes are referred to the absorbance of the dye only. SNAP-tag2 shows approximately 4.9-fold and 2.3-fold increases in absorbance of fluorogenic substrates for CF3P–MaP618 and TF–MaP618, respectively, compared to SNAPf-tag. Source data
Fig. 3
Fig. 3. Labeling kinetics and fluorescence brightness for SNAP-tag2 in live cells.
Experiments were conducted in live U2OS cells stably coexpressing HaloTag7–SNAPf-tag or HaloTag7–SNAP-tag2 together with mTurquoise2 (expression marker) in the nucleus. ac, Kinetic traces of SNAP-tag2 and SNAPf-tag fluorescence labeling in live cells with TMR (a), CPY (b) and SiR (c) substrates. U2OS cells were labeled with TF–fluorophore, CF–fluorophore and CP–fluorophore substrates (50 nM for TMR and CPY, 100 nM for SiR) and the labeling reaction was followed by confocal fluorescence microscopy. Fluorescence intensity changes of the substrates were normalized to the mTurquoise2 fluorescence over time. Data were fitted to a sigmoidal curve (n (TMR) ≥ 66 cells, n (CPY) ≥ 105 cells, n (SiR) ≥ 27 cells). Data are presented as the mean values ± 95% CI. Representative results from a biological duplicate are shown (replicate in Supplementary Fig. 12). d, The t1/2 of SNAP-tag2 and SNAPf-tag calculated from in-cell kinetic measurements described in ac. Values represent the mean values ± 95% CI from a biological duplicate. e, Comparison of HaloTag7, SNAP-tag2 and SNAPf-tag fluorescence brightness in confocal fluorescence microscopy with nonfluorogenic TMR and highly fluorogenic MaP618 substrates. U2OS cells were labeled with SLP substrates CA–TMR, CA-MaP618, TF–TMR and TF–MaP618 (100 nM overnight) and washed before imaging. Ratiometric projections are presented corresponding to fluorescence intensities of label to mTurquoise2 using orange-hot (TMR) and mpl-magma (MaP618) lookup tables. Scale bar, 20 µm. f,g, Quantitative analysis of single cells shown in e represented as violin plots. Numbers represent fold changes between the different SLPs (n ≥ 15 cells). Statistical analysis was conducted using a two-tailed unpaired t-test with Welch’s correction. ****P < 0.0001 and ***P = 0.0003. Source data
Fig. 4
Fig. 4. SNAP-tag2 performance in live-cell super-resolution microscopy.
a, Comparison of HaloTag7, SNAP-tag2 and SNAPf-tag performance in CLSM and STED microscopy. HeLa cells stably coexpressing HaloTag7, SNAP-tag2 or SNAPf-tag in the mitochondria (Cox8a localization sequence) together with mEGFP (no specific localization) were labeled with CA–SiR or TF–SiR (100 nM) for 1 h and washed afterward. SNAP-tag2 and HaloTag7 show comparable performance in STED imaging, while SNAPf-tag shows insufficient signal under the same imaging conditions. This experiment was performed three times with similar results. Scale bars, 10 µm. Lookup tables: green (mEGFP) and red-hot (SiR). b,c, CLSM and STED images of U2OS cells stably expressing Vim–SNAP-tag2 (b) or Vim–SNAPf-tag (c) labeled with CF–SiR (100 nM) for 1 h. Cells were washed before imaging. White squares in the overview images (left) highlight the area chosen for magnification and STED imaging (right). The experiment was repeated twice with similar results. The FWHM of single intermediate filament fibers highlighted in b was determined to be 108 (±23) nm and 146 (±7.0) nm, underlining the higher resolution achieved with SNAP-tag2 compared to SNAPf-tag (15 individual filaments from three individual images per condition). Scale bars, 5 µm (overview) and 1 µm (magnification). c,d, CLSM and STED images of U2OS cells stably expressing SNAP-tag2 (c) in the lumen of the endoplasmic reticulum (CalR–KDEL) and (d) on the outer mitochondrial membrane (TOMM20) labeled with CF–SiR (100 nM) for 1 h, demonstrating the versatility of using SNAP-tag2 in different cellular compartments. Cells were washed before imaging. Scale bars, 5 µm (overview) and 1 µm (magnification). e, Dual-color CLSM and STED images of U2OS cells expressing Vim–SNAP-tag2 and LifeAct–HaloTag7. SNAP-tag2 was labeled with CF–SiR (100 nM) and HaloTag7 was labeled with CA–MaP618 (100 nM) for 1 h; cells were washed afterward. Scale bars, 5 µm (overview) and 1 µm (magnification). Lookup tables: cyan (SNAP-tag2–SiR) and orange-hot (HaloTag7–MaP618).
Fig. 5
Fig. 5. Comparison of SNAP-tag2 and SNAPf-tag labeling of yeast peroxisomes.
a, CLSM images of H.polymorpha yeast cells expressing Pex3–SNAP-tag2 or Pex3–SNAPf-tag fusion proteins labeled with different SiR substrates. Yeast cells were labeled with CP–SiR or TF–SiR (250 nM) for 18 h and the cell wall was stained with Calcofluor white (CFW; 25 µg ml−1) for 15 min. Cells were washed before imaging. Scale bar, 10 µm. b, Bar plot representing the quantitative analysis of SNAP-tag2 and SNAPf-tag labeling with SiR substrates in yeast. Experiments were conducted in biological triplicates (n = 125 cells for each replicate) and the mean fluorescence intensity of SiR substrates was calculated (Supplementary Fig. 14). Error bars represent the s.d. SNAP-tag2 greatly outperforms SNAPf-tag in labeling of live yeast peroxisomes. c, Bottom, STED image of Pex3–SNAP-tag2 labeled with TF–SiR. Top, CLSM image of CFW-stained cell wall and merge of both channels. Scale bar, 1 µm. Right, line profile of labeled peroxisomes in STED imaging (highlighted as dashed line in the image). SNAP-tag2 with TF–SiR is suitable to perform live-cell STED microscopy in yeast. Source data
Extended Data Fig. 1
Extended Data Fig. 1. Correlation between pharmacokinetic properties and live cell performance of selected substrates.
QikProp (QP) Descriptors were calculated for non-fluorescent acetylated substrates using Schrödinger Maestro 12.3 software, regarding their: a, octanol/water partition coefficient (QP logP o/w), b, apparent MDCK cell permeability (QP PMDCK) and c, aqueous solubility (logS) and correlated to the experimentally determined performance of their corresponding TMR-derivatives in live cells. Computed parameters of the acetylated substrates can be found in Supplementary Table 2.
Extended Data Fig. 2
Extended Data Fig. 2. Statistical analysis of cell viability using flow cytometry.
U2OS cells were incubated either with TF-/CF-/CA-substrates [1 µM], DMSO (1 % v/v) or remained untreated. After 1 h incubation at 37 °C, both dead cells (supernatant) and live cells (detached with trypsin) were collected. SYTOX Blue dead cell stain [1 µM] was added and the cells were subsequently analyzed by flow cytometry. Experiment was conducted in technical triplicates. a, Flow cytometry histograms of cells stained with SYTOX Blue, showing the gating strategy for live and dead cell events. bd Dot plots showing the percentage of live cell events for b TMR-substrates, c CPY-substrates and d SiR-substrates in comparison to DMSO and untreated control samples. Each dot represents one replicate. The mean percentage of live cells from each triplicate is indicated as a black horizontal line. Error bars represent the s.d. The differences in cell viability of treated and untreated cells were not statistically significant (two-tailed unpaired t-test with Welch’s correction, p > 0.05, ns). Novel TF- and CF-substrates do not influence cell viability. Source data
Extended Data Fig. 3
Extended Data Fig. 3. Comparison of SNAP-tag2 und SNAPf-tag for labeling with different fluorescent substrates in live cells.
U2OS cell stably expressing mEGFP-SNAP-tag2 or mEGFP-SNAPf-tag were incubated with different a TMR, b CPY, c SiR, d MaP555 or e MaP618 substrates at [100 nM] or [500 nM] overnight or at [100 nM, 50 nM and 10 nM] for 1 h. Cells were washed and analyzed by flow cytometry (recorded n = 10000 cells). Analysis was done using FlowJo by gating for single cells and double positive labeling signal (as depicted in Supplementary Fig. 16) and the median of the fluorescent label/mEGFP was derived. Data are represented as median values ± mean s.d. of technical duplicates. SNAP-tag2 showed for most of the substrates a higher labeling ratio. Source data
Extended Data Fig. 4
Extended Data Fig. 4. Comparison of HaloTag7, SNAP-tag2 and SNAPf-tag performances in confocal fluorescence microscopy.
Experiments were conducted in live U2OS cells stably coexpressing HaloTag7-SNAPf-tag or HaloTag7-SNAP-tag2 together with mTurquoise2 (expression marker) in the nucleus. a, Comparison of HaloTag7, SNAP-tag2 and SNAPf-tag performances in confocal fluorescence microscopy with SiR substrates. U2OS cells were labeled with SLP-respective CA-/TF-SiR substrates at [100 nM] overnight and washed afterward. Ratiometric projections are presented corresponding to SiR label/mTurquoise2 on a magenta-hot look-up table. Scale bar: 20 µm. b, Violin plots representing the quantitative analysis of single cells shown in a. Numbers represent fold-changes between the different SLPs (n ≥ 15 cells, two-tailed unpaired t-test with Welch’s correction: ****P < 0.0001, ***P = 0.0003). c-f, Violin plots representing the quantitative analysis of different fluorescent substrates/mTurquoise2 for c TMR, d CPY, e, MaP618 and f SiR (n ≥ 13 cells). Source data
Extended Data Fig. 5
Extended Data Fig. 5. SNAPf-tag performance in CLSM and STED microscopy.
HeLa cells stably co-expressing SNAPf-tag in the mitochondria (Cox8a localization sequence) together with mEGFP (no specific localization) were labeled with TF-SiR (100 nM) for 1 h and washed afterward. SNAPf-tag showed insufficient signal under the same imaging conditions (0.5 % laser power) used for SNAP-tag2 and HaloTag7 and required the use of an increase laser power (5 %) to see a weak labeling signal. Scale bars: 10 µm. LUTs: green (mEGFP), red-hot (SiR).
Extended Data Fig. 6
Extended Data Fig. 6. SNAP-tag2 and SNAPf-tag labeling of live yeast peroxisomes.
a, CLSM images of H. polymorpha yeast cells expressing Pex3-SNAP-tag2 or Pex3-SNAPf-tag fusion proteins labeled with different MaP555 substrates. Yeast cells were labeled with CP- or TF-MaP555 (250 nM) for 18 h and the cell wall was stained with Calcofluor White (CFW; 25 µg/mL) for 15 min. Cells were washed prior to imaging. Scale bar: 10 µm. b, Bar plot representing the quantitative analysis of SNAP-tag2 and SNAPf-tag labeling with MaP555 substrates in yeast. Experiments were conducted in biological triplicates (n = 125 cells for each replicate) and the mean fluorescence intensity of MaP555 substrates was calculated (Supplementary Fig. 14). Error bars represent the s.d. Combination of SNAP-tag2 with CP-MaP555 show the best results for labeling of yeast peroxisomes. c, Bottom, STED image of Pex3-SNAP-tag2 labeled with CP-MaP555. Top, CLSM image of CFW stained cell wall and merge of both channels. LUTs: red-hot (MaP555) and gray (CFW). Scale bar: 1 µm. Right, line profile of labeled peroxisomes in STED (highlighted as white dashed line in the image). SNAP-tag2 with CP-MaP555 is well suited to perform live cell STED in yeast. Source data

References

    1. Hinner, M. J. & Johnsson, K. How to obtain labeled proteins and what to do with them. Curr. Opin. Biotechnol.21, 766–776 (2010). - PubMed
    1. Xue, L. et al. Imaging and manipulating proteins in live cells through covalent labeling. Nat. Chem. Biol.11, 917–923 (2015). - PubMed
    1. Keppler, A. et al. A general method for the covalent labeling of fusion proteins with small molecules in vivo. Nat. Biotechnol.21, 86–89 (2003). - PubMed
    1. Mollwitz, B. et al. Directed evolution of the suicide protein O6-alkylguanine-DNA alkyltransferase for increased reactivity results in an alkylated protein with exceptional stability. Biochemistry51, 986–994 (2012). - PubMed
    1. Los, G. V. et al. HaloTag: a novel protein labeling technology for cell imaging and protein analysis. ACS Chem. Biol.3, 373–382 (2008). - PubMed

LinkOut - more resources