. 2025 Aug;17(8):1950-1982.
doi: 10.1038/s44321-025-00257-9. Epub 2025 Jul 3.

A novel modulator of IL-6R prevents inflammation-induced preterm birth and improves newborn outcome

Affiliations

A novel modulator of IL-6R prevents inflammation-induced preterm birth and improves newborn outcome

France Côté et al. EMBO Mol Med. 2025 Aug.

Abstract

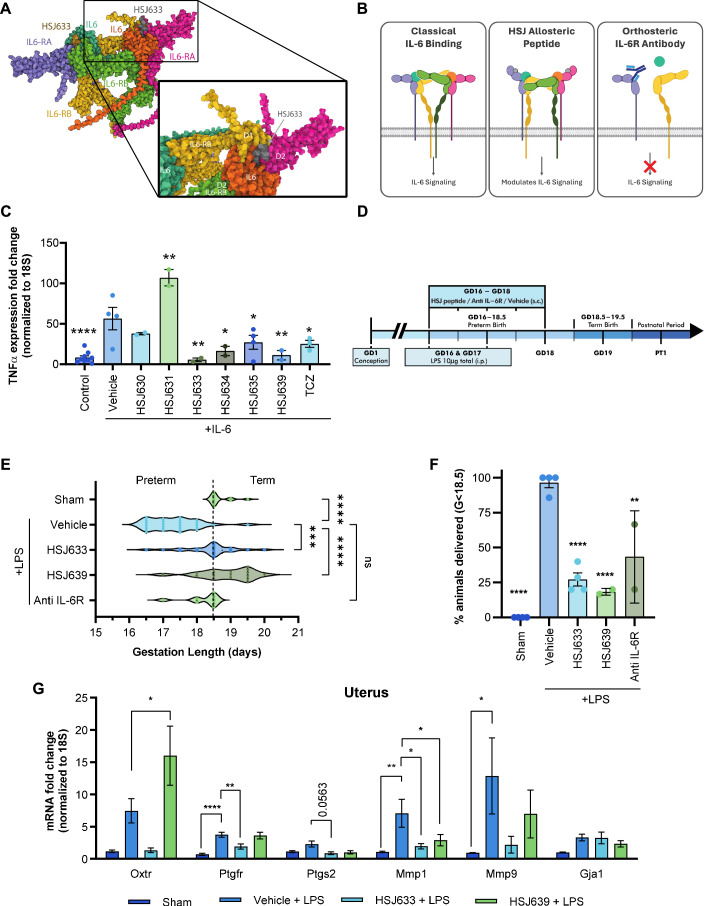
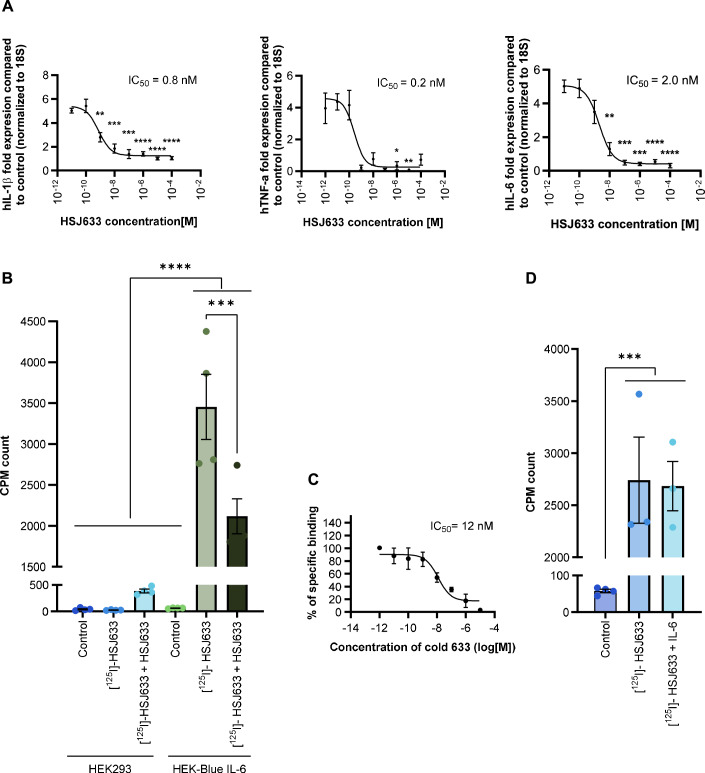
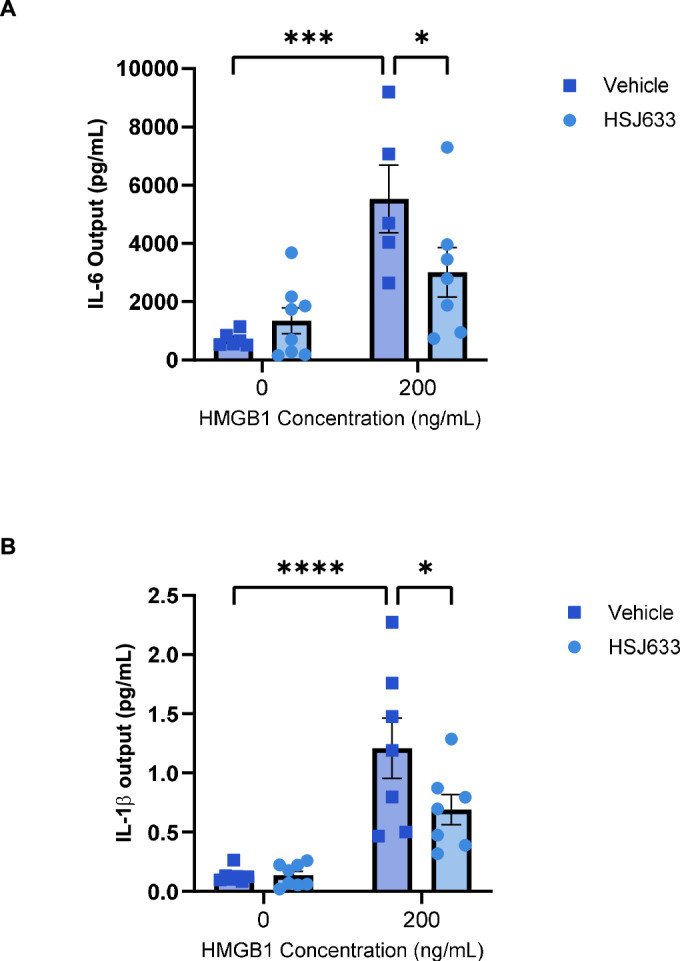
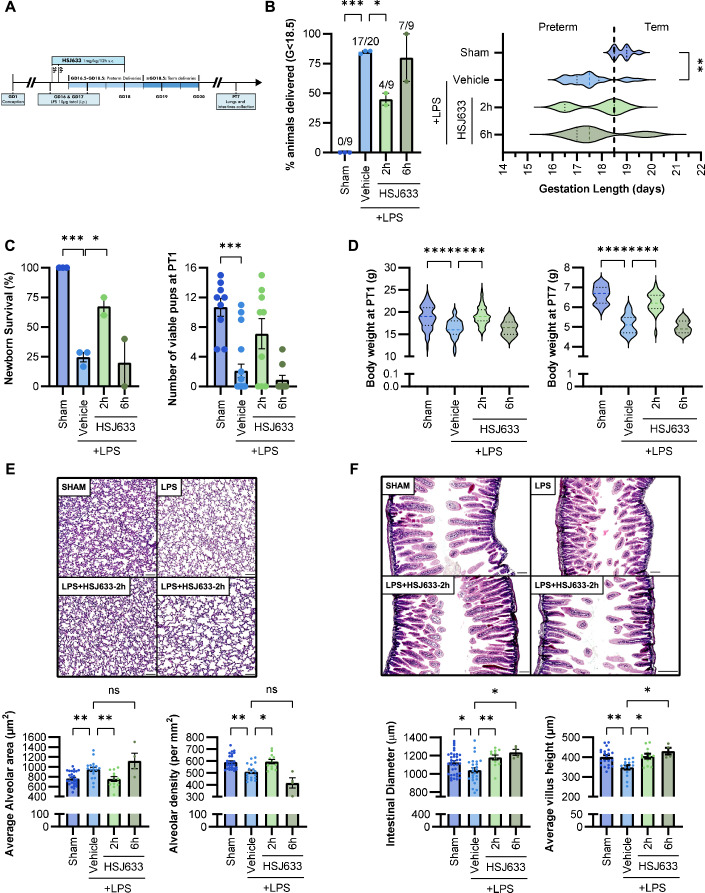
Preterm birth (PTB) is a major cause of neonatal mortality and morbidity. Evidence supports a determinant role for interleukin-6 (IL-6) in the pathophysiology of PTB. Our group developed a small peptide, HSJ633, that antagonizes the interleukin-6 receptor (IL-6R). Binding assays performed on HEK-Blue IL-6 cells reveal that HSJ633 appears to bind to IL-6R on a site remote from the IL-6 binding domain. Concordantly, HSJ633 selectively inhibits STAT3 phosphorylation while preserving the activation of cytoprotective AKT, p38, and ERK 1/2. In vivo, in a murine model of LPS-induced PTB, HSJ633 reduces inflammation in gestational and fetal tissues, preserves the integrity of fetal organs, and improves the survival of neonatal progeny when administered before and after the induction of labor by an inflammatory stimulus. Relevantly, the pharmacological inhibition of STAT3 in mice is sufficient to prevent PTB. Findings reveal first-in-class efficacy of a small peptide inhibitor of IL-6R, namely HSJ633, in impeding the inflammatory cascade associated with PTB and mitigating adverse neonatal outcomes.

Keywords: Inflammation; Interleukin-6; Neonatal Mortality; Non-competitive Modulator; Preterm Birth.


Conflict of interest statement

Disclosure and competing interests statement. The authors declare no competing interests.

Figures

Figure 1
Figure 1. Generation and screening of small peptide antagonists of IL-6R.
(A) AlphaFold model of the IL6/IL6RA (refers to IL-6R) /IL6RB (refers to gp130) hexamer, indicating the specific site from which HSJ633 nanopeptide is derived from on the IL6RA sequence; this schema does not imply the actual binding site of HSJ633 (to be determined). IL-6 in blue and orange, IL-6R in pink and purple, IL-6RB (gp130) in green and yellow (Abramson et al, 2024). (B) Schematic diagram depicting signaling induced by IL-6, a binding site for HSJ group peptides remote from the ligand binding site, and antibody against the IL-6 receptor (as per Tocilizumab). The latter interferes with the orthosteric binding site, resulting in inhibition of all signals transduced by IL-6R (right panel); the middle panel shows HSJ peptides that bias signaling of IL-6R and thus modulate transduction. IL-6 in blue and orange, IL-6R in pink and purple, IL-6RB (gp130) in green and yellow. (Boulanger et al, ; Kishimoto and Kang, 2022). (C) TNF-α expression is presented as a fold change (normalized to 18S) obtained by RT-qPCR in HEK-Blue IL-6 cells treated with IL-6 (3.86 nM [clinically relevant concentrations]), HSJ630, HSJ631, HSJ633, HSJ634, HSJ635, HSJ639 (1 μM), and tocilizumab (TCZ: 3.44 μM). Values are mean ± SEM of 2-9 samples per group. One-way ANOVA with Dunnett’s multiple comparisons test compared to the IL-6 + vehicle group. *P < 0.05, **P < 0.01, ****P < 0.0001. (D) Schematic experimental timeline. HSJ633, HSJ639 (2 mg/kg/day), a murine anti-IL-6 receptor antibody (Anti-IL-6R) (800 μg/kg/day) or vehicle is administered subcutaneously (s.c.) (repeated injection twice a day until GD18) and an intraperitoneal (i.p.) injection of LPS (4 μg on GD16 + 6 μg on GD17 LPS/100 μL saline, total 10 μg) was administered 30 min after the injection of HSJ633, HSJ639, or the anti-IL-6R. (E) Gestational length of mice in the LPS-induced PTB model. In total, 8–28 dams per group. Kruskal–Wallis test with Dunn’s multiple comparisons test compared to the LPS + vehicle group. ***P < 0.001, ****P < 0.0001. (F) Prematurity rate (<18.5 days gestation) of mice in the employed LPS-induced PTB model. Values are mean ± SEM of four different experiments with 2–12 dams per group per experiment. One-way ANOVA with Dunnett’s multiple comparisons test compared to the LPS + vehicle group. **P < 0.01, ****P < 0.0001. (G) mRNA of pro-inflammatory and uterine activation protein genes normalized to 18S in the uterus of mice extracted at G17.25 after LPS induction; histogram displays fold increase of gene products. Values are mean ± SEM of 4 dams per group by one-way ANOVA with Dunnett’s multiple comparisons test compared to the LPS + vehicle group. *P < 0.05, **P < 0.01, ****P < 0.0001. Source data are available online for this figure.
Figure 2
Figure 2. Pharmacological characterization of HSJ633.
(A) Inhibition of IL-6-induced cytokines by HSJ633. HEK-Blue IL-6 cells were stimulated with different concentrations of HSJ633 (10−11–10−4 M) or vehicle and induced by either IL-6 (3.86 nM [EC50 consistent]) or vehicle for 6 h. Expression of human IL-1β, TNFα and IL-6 mRNA was quantified by RT-qPCR and normalized to 18S. Values are mean ± SEM of 3–8 samples per group. **P < 0.01, ***P < 0.001, ****P < 0.0001. (B) Specific binding of HSJ633 to IL-6R-expressing cells. HEK-Blue IL-6 and HEK293 cells (devoid of IL-6R) were incubated with unlabeled HSJ633 (10−4 M) or vehicle and then exposed to either [125I]-HSJ633 (10−8 M) or vehicle for 1.5 h. Radioactivity was measured and graphed as CPM counts. Values are mean ± SEM of four samples per group. ***P < 0.001, ****P < 0.0001. (C) Displacement of bound [125I]-HSJ633 with cold HSJ633. Values are mean ± SEM of 3–4 samples per group. (D) Specific binding of [125I]-HSJ633 (10−8 M) to HEK-Blue IL-6 cells in the absence or presence IL-6 (10−4 M). IL-6 does not displace binding of HSJ633. Values are mean ± SEM of 3–4 samples per group. ***P < 0.001, by one-way ANOVA with Dunnett’s multiple comparisons test. Source data are available online for this figure.
Figure 3
Figure 3. HSJ633 reduces inflammation in human fetal membrane explants.
Placentas were collected from term not-in-labor deliveries (elective cesareans) between 37 and 42 weeks at the Royal Alexandra Hospital in Edmonton, Alberta and intact fetal membranes were removed from the placenta. Human fetal membrane explants were pre-incubated with HSJ633 and stimulated with HMGB1 at 0 and 200 ng/mL. (A) IL-6 and (B) IL-1β output in the supernatant were evaluated in a multiplex assay. Values are mean ± SEM of 5–8 samples per group. Two-way ANOVA with Fisher’s LSD test compared to HMGB1 0 and 200 ng/mL, and HMGB1 200 ng/mL with and without HSJ633. *P < 0.05, ***P < 0.001, ****P < 0.0001. Source data are available online for this figure.
Figure 4
Figure 4. Prophylactic administration of HSJ633 prevents LPS-induced inflammatory surge in gestational tissues and fluids.
(A) mRNA of Il1b and Il6 in uterus, placenta, and fetal membranes extracted on GD17.25 after LPS induction (normalized to Actb). Values are mean ± SEM of 6–14 dams per group for the uterus, 5–21 dams per group for the placenta and 4–8 dams per group for fetal membranes. *P < 0.05, **P < 0.01, ***P < 0.001, ****P < 0.0001. (B) IL-1β and IL-6 protein expression on GD17.25 after LPS induction in the placenta, uterus, and fetal membranes. Values are mean ± SEM of 4–11 dams per group for the uterus and the placenta and 4–5 dams per group for fetal membranes. *P < 0.05, **P < 0.01. (C) IL-1β and IL-6 quantification in amniotic fluid extracted on GD17.25 after LPS induction. Values are mean ± SEM of 3–9 dams per group with one-way ANOVA with Dunnett’s multiple comparisons test compared to LPS + vehicle group. *P < 0.05. (D) CRP quantification in maternal plasma extracted on GD17.25 after LPS induction. Values are mean ± SEM of 3–4 dams per group. IL-1β, IL-6, and CRP levels were determined by ELISA. *P < 0.05. One-way ANOVA with Dunnett’s multiple comparisons test compared to LPS + vehicle group was performed when the distribution was normal and Kruskal–Wallis test with Dunn’s multiple comparisons test compared to the LPS + vehicle group when data did not display normal distribution. Source data are available online for this figure.
Figure 5
Figure 5. Antenatal HSJ633 enhances neonatal survival and preserves organ integrity in progeny when administered prophylactically.
(A) Neonatal survival rate. Values are mean ± SEM of 2–4 different experiments with 3–8 dams per group per experiment. If two or more pups are alive, the litter is considered viable. One-way ANOVA with Dunnett’s multiple comparisons test compared to LPS + vehicle group. **P < 0.01, ***P < 0.001. (B) Viable pups at PT1. Values are mean ± SEM of 6–15 litter per group. Kruskal–Wallis test with Dunn’s multiple comparisons test compared to the LPS + vehicle group. *P < 0.05, ***P < 0.001. (C) Pup body weights at PT1 and PT7 (age corrected). Values are mean ± SEM of 49–105 pups for the left panel with Kruskal–Wallis test with Dunn’s multiple comparisons test compared to the LPS + vehicle group. Values are mean ± SEM of 4–12 pups for right panel with one-way ANOVA with Dunnett’s multiple comparisons test compared to LPS + vehicle group. *P < 0.05, **P < 0.01, ***P < 0.001. (D) Representative histological images of lung parenchyma stained with hematoxylin and eosin. Lungs were collected at PT7. Scale bars = 100 μm. Measurement of alveolar density (1 mm2) and average alveolar area (μm2) quantified on regions of interest of 1 mm2 are presented on histograms to the right of histology panels. Values are mean ± SEM of 4–13 pups per group. **P < 0.01, ***P < 0.001, ****P < 0.0001. (E) Representative histological images of intestines collected at PT7 and stained with hematoxylin and eosin; scale bars =  100 μm. Intestinal diameters (μm) of the regions of interest were quantified; villus height (μm) was measured using ZEN software: ten villi by region of interest were compiled; quantifications are presented on histograms to the right of images. Values are mean ± SEM of 4–18 pups per group. One-way ANOVA with Dunnett’s multiple comparisons test compared to LPS + vehicle group for (D, E). *P < 0.05. Source data are available online for this figure.
Figure 6
Figure 6. HSJ633 administered 2 h after LPS injection prevents inflammation in gestational tissues and fluids.
(A) mRNA of Il1b, Il6, Ptgs2, and Ccl2 in uterus, placenta, and fetal membranes extracted on GD17.25 after LPS induction (normalized to Actb). Values are mean ± SEM of 2–11 dams per group for the uterus, 4–7 dams per group for the placenta and 2–11 dams per group for fetal membranes. One-way ANOVA with Dunnett’s multiple comparisons test compared to the LPS + vehicle group was performed when the distribution was normal, and Kruskal–Wallis test with Dunn’s multiple comparisons test compared to the LPS + vehicle group when data did not display normal distribution. *P < 0.05, **P < 0.01. (B) Quantification of IL-1β and IL-6 by ELISA in amniotic fluid extracted on GD17.25 after LPS induction. Values are mean ± SEM of 2–6 dams per group. One-way ANOVA with Dunnett’s multiple comparisons test compared to the LPS + vehicle group was performed. *P < 0.05, **P < 0.01. Source data are available online for this figure.
Figure 7
Figure 7. HSJ633 administered 2 h after inducing preterm labor enhances neonatal survival and preserves organ integrity in the progeny.
(A) Schematic experimental timeline. An intraperitoneal (i.p.) injection of LPS (4 μg on GD16 + 6 μg on GD17 LPS/ 100 μL saline, total 10 μg) was administered. HSJ633(2 mg/kg/day), a murine anti-IL-6 receptor or vehicle is administered subcutaneously (s.c.) (repeated injection twice a day until GD18) 2 and 6 h after the LPS injection. (B) Prematurity rate (<18.5 days gestation) of mice in our LPS-induced PTB model. Values are mean ± SEM of 2–3 different experiments with 2–7 dams per group per experiment. One-way ANOVA with Dunnett’s multiple comparisons test compared to the LPS + vehicle group. Gestational length of mice in the LPS-induced PTB model. In total, 9–20 dams per group. Kruskal–Wallis test with Dunn’s multiple comparisons test compared to the LPS + vehicle group. *P < 0.05, **P < 0.01, ***P < 0.001 (C) Neonatal survival rate and viable pups at PT1. Values are mean ± SEM of 2–3 different experiments with 2 to 7 dams per group per experiment. If two or more pups are alive, the litter is considered viable. One-way ANOVA with Dunnett’s multiple comparisons test compared to LPS + vehicle group for neonatal survival and Kruskal–Wallis test with Dunn’s multiple comparisons test compared to the LPS + vehicle group for the number of viable pups at PT1. *P < 0.05, ***P < 0.001. (D) Pup body weights at PT1 and PT7 (age corrected). Values are mean ± SEM of 8–73 pups for left panel and 7–24 pups for right panel with one-way ANOVA with Dunnett’s multiple comparisons (PT7) or Kruskal–Wallis test with Dunn’s multiple comparisons (PT1) test compared to the LPS + vehicle group. ****P < 0.0001. (E) Representative histological images of lung parenchyma stained with hematoxylin and eosin. Lungs were collected at PT7. Scale bars = 100 μm. Measurement of alveolar density (1 mm2) and average alveolar area (μm2) quantified on regions of interest of 1 mm2 are presented on histograms to the right of histology panels. Values are mean ± SEM of 4–27 pups per group. Kruskal–Wallis test with Dunn’s multiple comparisons test compared to the LPS + vehicle group for the right panel and one-way ANOVA with Dunnett’s multiple comparisons compared to the LPS + vehicle group for the left panel. *P < 0.05, **P < 0.01. (F) Representative histological images of intestines collected at PT7 and stained with hematoxylin and eosin; scale bars =  100 μm. Intestinal diameters (μm) of the regions of interest were quantified; villus height (μm) was measured using ZEN software: ten villi by region of interest were compiled; quantifications are presented on histograms to the right of images. Values are mean ± SEM of 4–38 pups per group. One-way ANOVA with Dunnett’s multiple comparisons test compared to LPS + vehicle group was performed when the distribution was normal and Kruskal–Wallis test with Dunn’s multiple comparisons test compared to the LPS + vehicle group when data did not display normal distribution. *P < 0.05, **P < 0.01, ***P < 0.001. Source data are available online for this figure.
Figure 8
Figure 8. HSJ633 selectively inhibits STAT3 activation, critically involved in PTB.
(AD) Quantification of canonical IL-6R-coupled signaling in HEK-Blue IL-6 cells. Cells were pre-incubated with HSJ633 (1 μM), TCZ (3.44 μM) or vehicle, and subsequently stimulated with IL-6 (3.86 nM). Membranes were blotted for total and phospho-p38, ERK, AKT and STAT3. Values are mean ± SEM of 2–3 samples per group. One-way ANOVA with Dunnett’s multiple comparisons test compared to IL-6 + vehicle group. *P < 0.05, **P < 0.01. (E) Dose-dependent effect of HSJ633 on phospho-STAT3 inhibition was quantified by QUANTI-Blue Assay. Values are mean ± SEM of 3–4 samples per group. ***P < 0.001, ****P < 0.0001. (F, G) Proteins were extracted from the placenta 6 h after LPS injection. HSJ633 was given 30 min before LPS injection in (E) and 2 h after LPS injection in (F). Membranes were blotted for total and phospho-STAT3. Values are mean ± SEM of 3–8 dams per group. One-way ANOVA with Dunnett’s multiple comparisons test compared to LPS + vehicle group. *P < 0.05, ***P < 0.001. (H) Gestational length and rate of prematurity ( < 18.5 days gestation) in mice treated with STAT3 inhibitor, NSC74859 (5 mg/kg/day) injected s.c. in mice on GD16 after LPS stimulation. Values are mean ± SEM of 13–17 dams per group for gestation length and Kruskal–Wallis test with Dunn’s multiple comparisons test compared to the LPS + vehicle group. Values are mean ± SEM of 2–3 different experiments with 3–7 dams per group per experiment. One-way ANOVA with Dunnett’s multiple comparisons test compared to LPS + vehicle group for prematurity rate. **P < 0.01, ***P < 0.001. TCZ Tocilizumab. Source data are available online for this figure.
Figure EV1
Figure EV1. HSJ633 reduces STAT3 activation in murine Ba/F3-mgp130-IL-6Rα cells but not in murine cells without IL-6Rα.
Representative Western blot displaying the levels of IL-6Rα, gp130 and STAT3 in Ba/F3-polylinker, Ba/F3-mgp130, and Ba/F3-mgp130-IL-6Rα cells treated with IL-6 (1.92 nM), HSJ633 (0.1 mM) and HSJ633 + IL-6. (A) Western blot image showing IL-6Rα and GAPDH bands. (B) Western blot image showing gp130 and β-actin bands. (C) Western blot image showing phospho-STAT3 and total STAT3 bands. (D) Quantification of STAT3 activation in Ba/F3-mgp130-IL-6Rα, presented as mean ± SEM of 3-4 samples per group. Densitometric analysis of the bands indicates a significant reduction in STAT3 activation in HSJ633 + IL-6-treated cells relative to IL-6. One-way ANOVA with Dunnett’s multiple comparisons test compared to IL-6. *P < 0.05, **P < 0.01.
Figure EV2
Figure EV2. Prophylactic administration of HSJ633 reduces inflammation in reproductive tissues.
(A) TNF-α concentrations (quantified by ELISA) in the uterus and placenta on GD17.25. Values are mean ± SEM of 4–10 dams per group and one-way ANOVA with Dunnett’s multiple comparisons test compared to LPS + vehicle group was performed for the placenta. Values are mean ± SEM of 4–11 dams per group and Kruskal–Wallis test with Dunn’s multiple comparisons test compared to the LPS + vehicle group was performed for the uterus. *P < 0.05, **P < 0.01. (B) mRNA expression on GD17.25 in the uterus, placenta, and fetal membranes of various genes involved in PTB (normalized to Actb). Values are mean ± SEM of 4–12 dams per group for the uterus, 4–10 dams per group in the placenta and 4–8 dams per group for fetal membranes. *P < 0.05, **P < 0.01, ***P < 0.001,
Figure EV3
Figure EV3. LPS-induced inflammatory cytokines in fetal organs.
mRNA expression (determined by RT-qPCR) of IL-1β, IL-6 and TNF-α in murine lung and intestine collected on GD17.25 after LPS induction (normalized to Actb). Values are mean ± SEM of 2–5 samples per group. One-way ANOVA with Dunnett’s multiple comparisons test compared to LPS + vehicle group. *P < 0.05.
Figure EV4
Figure EV4. Distribution of HSJ633 to fetal placental compartment.
Biodistribution of prophylactic HSJ633-FITC 4 h post subcutaneous injection in pregnant mice on GD17 in the placenta. Green fluorescence was quantified. Values are mean ± SEM of 11–12 samples per group. 1000 μm scale bars. *P < 0.05, ***P < 0.001 by the Kruskal–Wallis test with Dunn’s multiple comparisons test compared to the LPS + vehicle group.
Figure EV5
Figure EV5. LPS induces an inflammatory response as early as 1 h post-administration in gestational tissues.
(AC) mRNA expression (determined by RT-qPCR) of IL-1β, IL-6, Ccl3, Ptgs2, Ptges, and Oxtr in the uterus, placenta, and fetal membranes collected 1 h, 2 h and 6 h after LPS injection on GD16 (normalized to Actb). Values are mean ± SEM of 3–7 samples per group. Unpaired T test compared to sham group at each time point with Mann–Whitney comparison when data were not distributed normally. *P < 0.05, **P < 0.01.
Figure EV6
Figure EV6. Importance of soluble IL-6R in human amniotic epithelial cells and in Ba/F3-mgp130-IL-6Rα IL-6-triggered signaling and in LPS-induced PTB.
(A) Amniotic epithelial cells were stimulated with IL-6 and/or sIL-6R (100 ng/mL for both) in absence or presence of HSJ633 (1 μM), TCZ (3.44 μM), or vehicle. Membranes were blotted for phospho-STAT3 and normalized to total STAT3. Representative Western blot gel on the right and compiled histogram data on the left. Values are mean ± SEM of 4–7 samples per group. One-way ANOVA with Dunnett’s multiple comparisons test compared to sIL-6R + IL-6 group. (B) Quantification of STAT3 activation in Ba/F3-mgp130-IL-6Rα treated with Hyper IL-6 (100 ng/mL), HSJ633 (0.1 mM) and Anti-IL-6R (200 μg/mL). Representative Western blot displaying the levels of STAT3 in Ba/F3-mgp130-IL-6Rα cells treated with hyper IL-6. Quantification of STAT3 activation presented as mean ± SEM of 3–5 samples per group. Densitometric analysis of the bands indicates a significant reduction in STAT3 activation in HSJ633+Hyper IL-6-treated cells relative to Hyper IL-6. One-way ANOVA with Dunnett’s multiple comparisons test compared to Hyper IL-6. *P < 0.05, **P < 0.01, ***P < 0.001. (C) Gestational length (left panel), data are presented as mean ± SEM of 4–12 dams per group and Kruskal–Wallis test with Dunn’s multiple comparisons test compared to the LPS + vehicle group for gestation length. Rate of prematurity (born on GD < 18.5; right panel) in mice treated with soluble gp130 (sgp130) injected s.c. on GD16. Data are presented as mean ± SEM of 1–4 different experiments with 2 to 8 dams per group per experiment. One-way ANOVA with Dunnett’s multiple comparisons test compared to the LPS + vehicle group. *P < 0.05, **P < 0.01, ***P < 0.001, ****P < 0.0001. TCZ Tocilizumab.

References

    1. Abramson J, Adler J, Dunger J, Evans R, Green T, Pritzel A, Ronneberger O, Willmore L, Ballard AJ, Bambrick J et al (2024) Accurate structure prediction of biomolecular interactions with AlphaFold 3. Nature 630:493–500 - PMC - PubMed
    1. Aden K, Breuer A, Rehman A, Geese H, Tran F, Sommer J, Waetzig GH, Reinheimer TM, Schreiber S, Rose-John S et al (2016) Classic IL-6R signalling is dispensable for intestinal epithelial proliferation and repair. Oncogenesis 5:e270 - PMC - PubMed
    1. Arntzen KJ, Kjøllesdal AM, Halgunset J, Vatten L, Austgulen R (1998) TNF, IL-1, IL-6, IL-8 and soluble TNF receptors in relation to chorioamnionitis and premature labor. J Perinat Med 26:17–26 - PubMed
    1. Balany J, Bhandari V (2015) Understanding the impact of infection, inflammation, and their persistence in the pathogenesis of bronchopulmonary dysplasia. Front Med 2:90 - PMC - PubMed
    1. Beaudry-Richard A, Nadeau-Vallée M, Prairie É, Maurice N, Heckel É, Nezhady M, Pundir S, Madaan A, Boudreault A, Hou X et al (2018) Antenatal IL-1-dependent inflammation persists postnatally and causes retinal and sub-retinal vasculopathy in progeny. Sci Rep 8:1–13 - PMC - PubMed

LinkOut - more resources