

Physiological, biochemical, and transcriptomic analyses reveal potential candidate genes of Platostoma palustre in response to salt stress
- PMID: 40610913
- PMCID: PMC12224829
- DOI: 10.1186/s12870-025-06858-3
Physiological, biochemical, and transcriptomic analyses reveal potential candidate genes of Platostoma palustre in response to salt stress
Abstract
Background: Salt stress poses a genuine threat to plants, impeding their growth, development, and yields. Platostoma palustre (Blume) A.J.Paton (P. palustre) is an important medicinal plant in tropical and subtropical regions; however, the molecular mechanisms underlying P. palustre response to salt stress remain poorly understood. To better understand the molecular response of P. palustre plants to salt stress, we employed an integrated approach based on physiological, biochemical, and transcriptomic analyses.
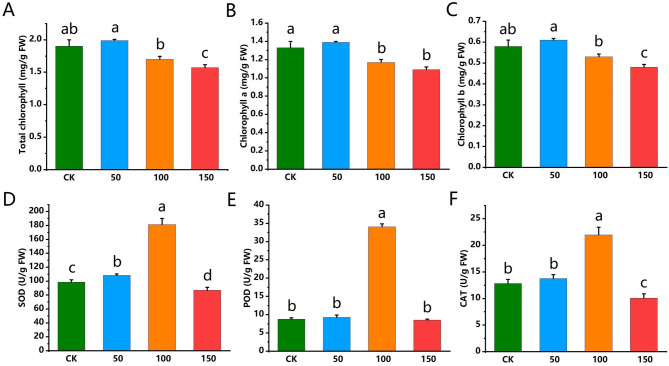
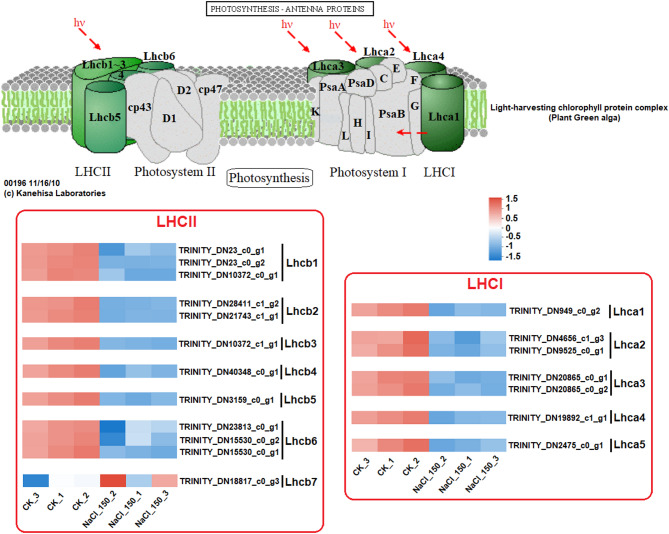
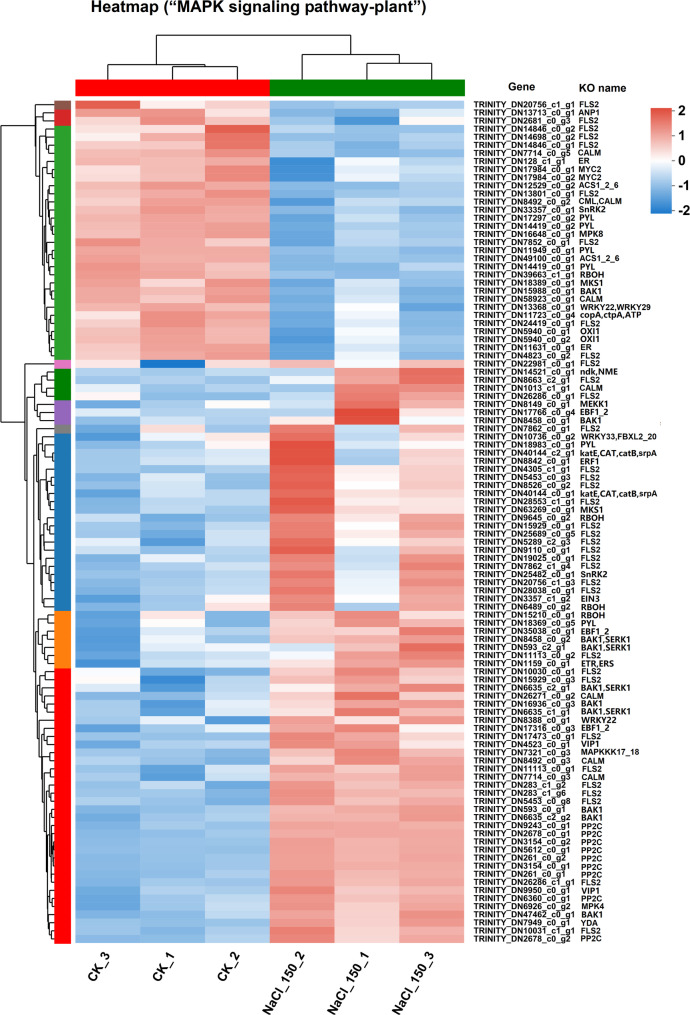
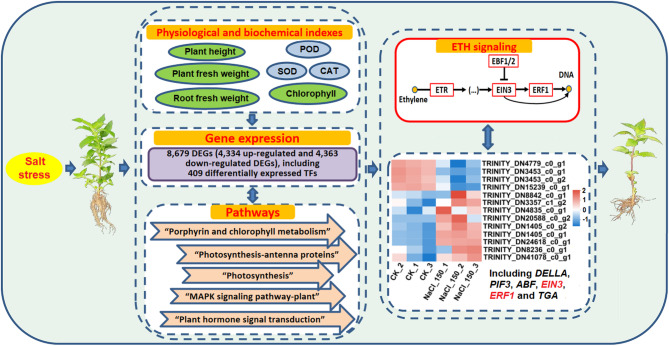
Results: In this study, salt stress significantly restrained the growth of P. palustre and led to the accumulation of antioxidant enzymes (SOD, POD, and CAT). Besides, the chlorophyll content significantly decreased with the increase in NaCl concentration. Transcriptomic analysis revealed 8,679 differentially expressed genes (DEGs) (4,334 were up-regulated and 4,363 were down-regulated) between control (CK) and salt stress (150 mM NaCl). KEGG enrichment analysis showed that these DEGs were significantly enriched in "plant hormone signal transduction", "MAPK signaling pathway-plant", "photosynthesis - antenna proteins", "starch and sucrose metabolism", etc. Among the DEGs, 409 DEGs were identified as transcription factors (TFs), belonging to 25 families including MYB_superfamily, AP2/ERF, C2C2, bHLH, NAC, WRKY, and so on. In KEGG enrichment analysis of the identified TFs, 13 showed significant enrichment in "plant hormone signal transduction". Notably, EIN3 (TRINITY_DN3357_c1_g2) and ERF1 (TRINITY_DN8842_c0_g1) involved in the ethylene (ETH) signaling were suggested potential candidates for salt stress response in P. palustre.
Conclusions: This study unravels key salt-responsive genes in P. palustre, facilitating the development of salinity-resistance varieties.
Keywords: Platostoma palustre (Blume) A.J.Paton; ETH signaling; MAPK signaling pathway; Plant hormone signal transduction; Salt stress; Transcriptomic analysis.
© 2025. The Author(s).
Conflict of interest statement
Declarations. Ethics approval and consent to participate: All our experiments have complied with relevant institutional, national, and international guidelines and legislation. Plants of P. palustre were provided by Guangxi Key Laboratory of Medicinal Resources Protection and Genetic Improvement, Nanning, China. The plant materials don’t include any wild species at risk of extinction. We comply with relevant institutional, national, and international guidelines and legislation for plant study. Consent for publication: Not applicable. Competing interests: The authors declare no competing interests.
Figures


Similar articles
-
Identification of key modules and genes in response to high-temperature stress in Platostoma palustre based on WGCNA.BMC Plant Biol. 2025 May 24;25(1):695. doi: 10.1186/s12870-025-06686-5. BMC Plant Biol. 2025. PMID: 40419951 Free PMC article.
-
Analysis of the AP2/ERF transcription factor family in Eriobotrya japonica and its role in exogenous melatonin-mediated regulation of salt stress.Funct Integr Genomics. 2025 Jul 27;25(1):161. doi: 10.1007/s10142-025-01667-1. Funct Integr Genomics. 2025. PMID: 40715545
-
Molecular Mechanisms Underlying Salt Tolerance in Maize: A Combined Transcriptome and Metabolome Analysis.Plants (Basel). 2025 Jul 2;14(13):2031. doi: 10.3390/plants14132031. Plants (Basel). 2025. PMID: 40648040 Free PMC article.
-
Salt stress-responsive transcription factors provide insights to enhance barley improvement: a review.Planta. 2025 Jul 16;262(3):56. doi: 10.1007/s00425-025-04760-8. Planta. 2025. PMID: 40670803 Review.
-
Systemic pharmacological treatments for chronic plaque psoriasis: a network meta-analysis.Cochrane Database Syst Rev. 2021 Apr 19;4(4):CD011535. doi: 10.1002/14651858.CD011535.pub4. Cochrane Database Syst Rev. 2021. Update in: Cochrane Database Syst Rev. 2022 May 23;5:CD011535. doi: 10.1002/14651858.CD011535.pub5. PMID: 33871055 Free PMC article. Updated.
References
-
- Machado R, Serralheiro R. Soil salinity: effect on vegetable crop growth. Management practices to prevent and mitigate soil salinization. Horticulturae. 2017;3:13.
-
- Parida AK, Das AB. Salt tolerance and salinity effects on plants: a review. Ecotoxicol Environ Saf. 2005;60(3):324–49. - PubMed
-
- Li J, Wang J. Integrated life cycle assessment of improving saline-sodic soil with flue gas desulfurization gypsum. J Clean Prod. 2018;202:332–41.
MeSH terms
Grants and funding
LinkOut - more resources
Full Text Sources
Research Materials
Miscellaneous
