

Estimating years of life lost due to premature mortality at regional level in France in 2017, using a probabilistic redistribution approach
- PMID: 40611076
- PMCID: PMC12224698
- DOI: 10.1186/s12889-025-23559-6
Estimating years of life lost due to premature mortality at regional level in France in 2017, using a probabilistic redistribution approach
Abstract
Background: Years of life lost (YLL) due to premature mortality is an important metric to assess the fatal impact of diseases. The main objectives of this study were to apply the four-step probabilistic method to redistribute ill-defined deaths (IDDs) and to quantify the premature mortality burden at regional level in France for 2017.
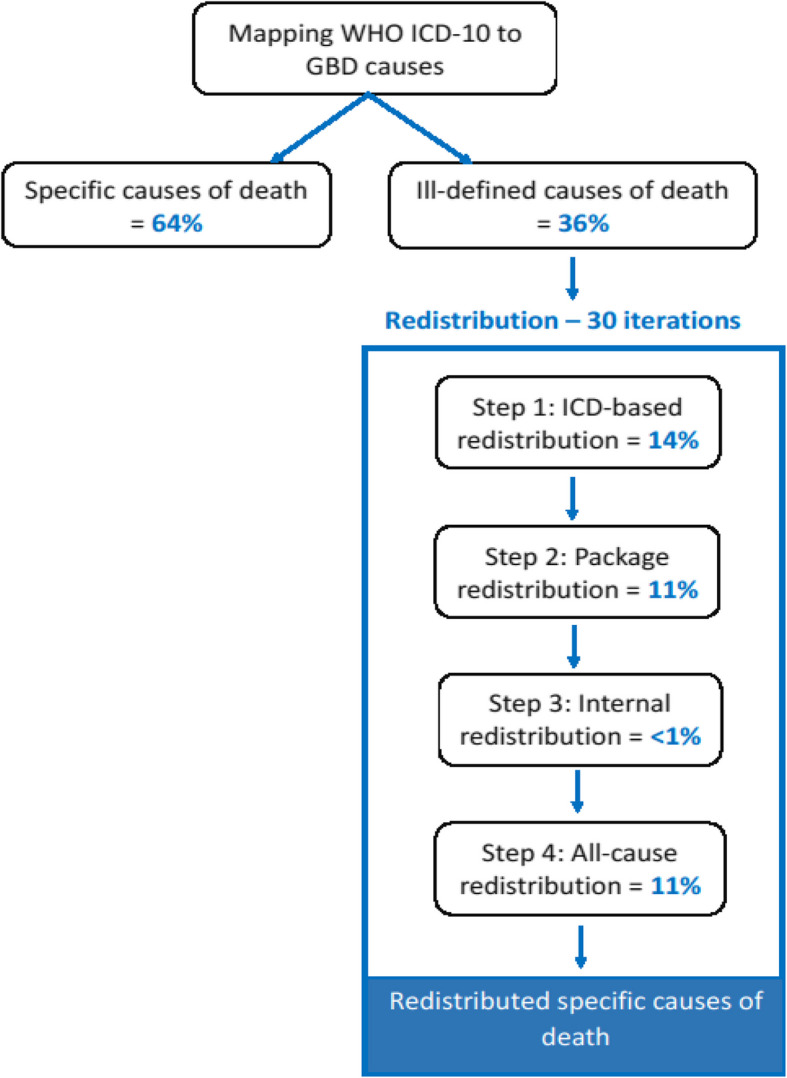
Methods: We used the statistical database on medical causes of death derived from death certificate collection and coded by the Center for Epidemiology on Medical Causes of deaths (INSERM-CépiDc). First, we mapped the specific ICD-10 codes that define the underlying cause of death (CoD) to the Global Burden of Disease (GBD) cause list. Second, identified IDDs were redistributed to specific ICD-10 codes. A four-step probabilistic redistribution developed for the Belgium Burden of Disease (BeBOD) study was adopted to fit the French context: redistribution using predefined ICD codes, package redistribution using multiple causes of death data, internal redistribution, and redistribution to all causes. Finally, Standard Expected Years of Life Lost (SEYLL) and age-standardized SEYLL rates (ASYR) were calculated at regional level, using the GBD 2019 reference life table.
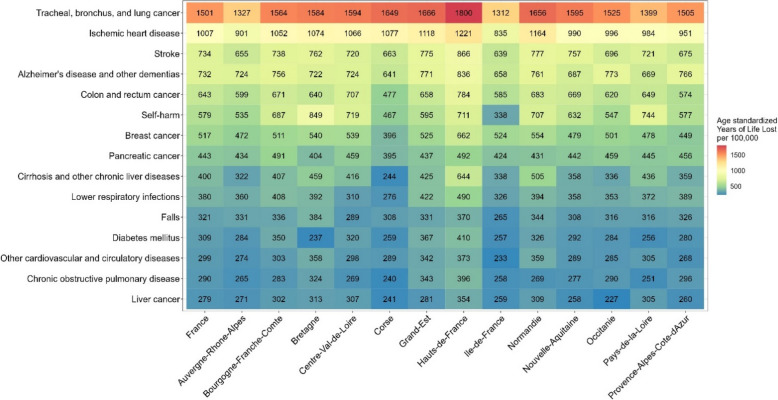
Results: In France, 36% of all deaths were IDDs in 2017. The majority was redistributed using predefined ICD codes (14%), followed by the package redistribution using multiple causes of death data (11%), all-cause redistribution (11%) and internal redistribution (< 1%). The total number of SEYLL was 9.6 million for all causes, (4.1 million in females [43%] and 5.5 million in males [57%]). Tracheal, bronchus, and lung cancer ranked first (10%), followed by ischemic heart disease (7%), and Alzheimer's disease and other dementias (6%) in terms of SEYLL. For all causes, we observed the lowest ASYRs in Corse for females (8970 per 100 000) and in Ile-de-France for males (16 109 per 100 000).
Conclusions: We quantified the full mortality burden for the first time in France at regional level, based on a new probabilistic redistribution method developed by researchers from Sciensano before COVID-19 pandemic. These estimates are important for future investigations on the contribution of social inequalities and risk factors to all-cause mortality in France with a focus on regional differences.
Keywords: Cause of death; France; Garbage Code; Ill-defined deaths; Life expectancy; Mortality; Redistribution; YLL; Years of life lost.
© 2025. The Author(s).
Conflict of interest statement
Declarations. Ethics approval and consent to participate: This study was conducted in accordance with the ethical standards of the Helsinki Declaration of 1975 (revised in 2013). Consent for publication: Not applicable. Competing interests: The authors declare no competing interests.
Figures


References
-
- Murray CJL, Lopez AD. Measuring global health: motivation and evolution of the Global Burden of Disease Study. The Lancet. 2017;390(10100):1460–4. - PubMed
-
- Murray CJL, Ezzati M, Flaxman AD, Lim S, Lozano R, Michaud C, Naghavi M, Salomon JA, Shibuya K, Vos T, et al. GBD 2010: design, definitions, and metrics. The Lancet. 2012;380(9859):2063–6. - PubMed
-
- Murray CJL, Lopez AD, World Health O, World B, Harvard School of Public H: The Global burden of disease : a comprehensive assessment of mortality and disability from diseases, injuries, and risk factors in 1990 and projected to 2020 : summary / edited by Christopher J. L. Murray, Alan D. Lopez. In. Geneva: World Health Organization; 1996.
MeSH terms
LinkOut - more resources
Full Text Sources
