. 2025 Jul 3;24(1):229.
doi: 10.1186/s12944-025-02647-x.

PPP2CB aggravates atherosclerosis-related dyslipidemia via LOX-1/MAPK/ERK signaling pathway

Affiliations

PPP2CB aggravates atherosclerosis-related dyslipidemia via LOX-1/MAPK/ERK signaling pathway

He An et al. Lipids Health Dis. .

Abstract

Background: Dyslipidemia has been extensively documented as a key driver of cardiovascular pathology. Regulating lipid homeostasis holds promise for treating atherosclerosis (AS). Although the protein phosphatase 2 catalytic subunit beta (PPP2CB) is involved in post-transcriptional gene regulation, its role in AS-associated dyslipidemia is not well understood.

Methods: The study included both human participants and animal models. The following techniques were employed: cell culture, extraction of exosomes, preparation of pooled hyperlipidemic serum (HS), transfection, western blotting, immunofluorescence staining, quantitative reverse transcription polymerase chain reaction (qRT-PCR), co-immunoprecipitation, low-density lipoprotein cholesterol (LDL-C) uptake assay, biochemical assays, assessment of aortic atherosclerotic lesions, as well as statistical analysis.

Results: This study identified a marked upregulation of PPP2CB expression in peripheral blood leukocytes of AS patients, artery plaque of ApoE-/- mice given a high-fat diet, and hepatic cells exposed to hyperlipidemic stimuli. Overexpression of PPP2CB in hepatic cells exacerbated lipid accumulation and low-density lipoprotein uptake, whereas silencing PPP2CB mitigated this effect. Immunofluorescence co-localization and co-immunoprecipitation analysis confirmed a direct interaction between PPP2CB and lectin-like oxidized LDL receptor-1 (LOX-1). Notably, PPP2CB manipulation disrupted hyperlipidemia-induced LOX-1 expression. Additionally, PPP2CB-mediated lipid dysregulation was linked to the activation of the LOX-1/ mitogen-activated protein kinase (MAPK)/ extracellular signal-regulated kinase (ERK) signaling cascade.

Conclusions: These results unveil PPP2CB as a novel lipid regulator in the progression of pathological AS and highlight its involvement in signaling regulation during abnormal lipid metabolism. PPP2CB could be considered a promising candidate for biomarker development and therapeutic intervention in AS.

Keywords: Atherosclerosis; Dyslipidemia; LOX-1; Liver cells; PPP2CB.


Conflict of interest statement

Declarations. Ethics approval consent to participate: The studies involving human participants were reviewed and approved by the Medical Ethics Committee of Taihe Hospital, Hubei University of Medicine. Written informed consent was obtained from all participants prior to enrollment. The animal experiments were approved by the Animal Care and Use Committee of Hubei University of Medicine. Consent for publication: Not applicable. Competing interests: The authors declare no competing interests.

Figures

Fig. 1
Fig. 1
Detection and characterization of genes (DEGs) associated with AS. (A) The heatmap displays the mRNA expression in plasma exosomes from 5 STEMI patients and 3 controls, obtained through RNA-seq. Red indicates upregulated genes, while green indicates downregulation. The heat map highlights significant mRNA expression differences between STEMI patients and controls. (B) Comparison of PPP2CB mRNA expression levels in peripheral blood leukocytes across the control cohort (n = 302) versus the AS cohort (n = 308). Results show that PPP2CB expression is significantly higher in the AS group, suggesting a potential association with the pathophysiology of atherosclerosis. (C) Plasma LDL levels in both AS and control cohorts. The findings indicate a notable LDL increase in AS patients, implying greater susceptibility to cardiovascular events. (D) The correlation between PPP2CB expression in peripheral blood (n = 418) leukocytes and plasma LDL levels. The relationship between PPP2CB expression and LDL concentration was assessed using Pearson correlation analysis, yielding a P-value of 0.041 and a correlation coefficient (R) of 0.1. A positive correlation was observed, suggesting a potential link between PPP2CB expression and lipid metabolism. **P < 0.01, ***P < 0.001
Fig. 2
Fig. 2
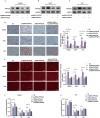
Analysis of PPP2CB expression in ApoE−/− hyperlipidemic mouse plaques and HS-induced hepatic cells. (A) Heart tissue samples from three murine groups (n = 3 per mouse per group) were subjected to HE staining to assess plaque regions. HE staining was used to evaluate plaque size and morphological changes, confirming that HFD successfully induced atherosclerosis. The plaque burden was quantified as the ratio of plaque area to total vessel area using ImageJ, with values normalized to the control group and expressed as fold changes. (B) Heart tissue samples from three groups of mice were subjected to Oil Red O staining for detection of plaque area. This experiment evaluated the extent of lipid accumulation in the plaques, further supporting the development of the atherosclerotic model in HFD-fed mice. The plaque burden was quantified as the ratio of plaque area to total vessel area using ImageJ, and the values were calibrated against the control group and reported in terms of fold change. (C) PPP2CB protein levels in heart tissue plaques of ApoE−/− mice exposed to either ND or HFD were analyzed by Western blotting. The results show higher PPP2CB protein expression in the HFD group, suggesting its potential involvement in the progression of atherosclerosis. (D) PPP2CB mRNA expression levels in HepG2, Huh7, and LO2 cells were determined by qRT-PCR after 24 h of HS treatment. This experiment aimed to evaluate whether HS treatment affects PPP2CB gene expression in different hepatic cell lines, serving as a potential marker for lipid metabolism and inflammation. (E) PPP2CB protein expressions levels in HepG2, Huh7, and LO2 cells were measured by Western blotting after 24 h of HS treatment. Immunoblot analysis revealed a significant upregulation in PPP2CB levels. **P < 0.01, and ***P < 0.001
Fig. 3
Fig. 3
Analysis of intracellular lipid accumulation in hepatic cells following PPP2CB overexpression or silencing. (A-C) Western blotting results demonstrated successful modulation of PPP2CB expression in HepG2, Huh7, as well as LO2 cells through overexpression and silencing strategies, thereby enabling evaluation of its impact on lipid metabolism in these hepatic cell lines. (D) Oil Red O-based lipid visualization (scale bar = 100 μm) in HepG2, Huh7, and LO2 cells. The quantification of lipid droplets is shown on the right, expressed as fold changes relative to the NC group. Quantification of lipid droplets was performed to evaluate the extent of lipid accumulation in response to altered PPP2CB expression. (E) HepG2, Huh7, and LO2 cells were stimulated with fluorescence-labeled LDL (LDL-DyLight 550) for 3.5 h. Representative fluorescence images of intracellular LDL are shown (scale bar = 100 μm). The fluorescence intensity of intracellular LDL was quantified. The red fluorescence indicates the labeling of LDL. This experiment assessed the uptake of LDL, a key process in lipid metabolism. (F) At 24 h post-transfection, HepG2 cells were treated with 10% HS for 12 h. The concentrations of TC, TG as well as LDL in the supernatant were measured using an autoanalyzer to evaluate lipid secretion under altered PPP2CB expression. (G) The LO2 cells were treated as described in panel. The supernatant levels of TC, TG, as well as LDL were measured using autoanalyzer. This experiment provided additional insights into PPP2CB-mediated lipid handling in hepatocytes. *P < 0.05, **P < 0.01, and, ***P < 0.001
Fig. 4
Fig. 4
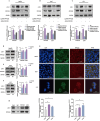
Analysis of the relationship between PPP2CB and LOX-1 in hepatic cells. (A-C) Cells underwent transfection negative control (NC), expRNA-PPP2CB (over-expression), or siRNA-PPP2CB (silencing), and then challenged with 10% HS for 24 h. Immunoblotting analysis and densitometric quantification were performed to measure the expression levels of PPP2CB and LOX-1. The results showed that overexpression of PPP2CB enhanced LOX-1 expression, while knockdown of PPP2CB reduced LOX-1 expression. (D-F) HepG2 (D), Huh7 (E), and LO2 (F) were challenged with 10% HS for 24 h. Western blotting analysis and densitometric quantification of PPP2CB alongside LOX-1 were performed. Findings demonstrated that HS treatment led to a synchronous upregulation of both PPP2CB and LOX-1 expression, further supporting their concurrent expression in hepatic cells. (G) HepG2, Huh7, and LO2 were treated as described in panels. (D-F) Illustrative immunofluorescence images of PPP2CB (red) and LOX-1 (green) are shown. Nuclei were stained using DAPI (blue). Scale bar = 25 μm. PPP2CB and LOX-1 colocalization in cells suggests that the two proteins may interact with each other. (H) Co-immunoprecipitation of PPP2CB and LOX-1 in LO2 cells challenged with 10% HS. A significant increase in LOX-1 protein level was detected within the PPP2CB antibody complex relative to both the IgG control and input groups, indicating a potential direct interaction between PPP2CB and LOX-1. *P < 0.05, **P < 0.01, and ***P < 0.001
Fig. 5
Fig. 5
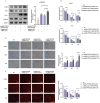
LOX-1 promotes lipid accumulation through MAPK/ERK pathway activation. (A) LO2 cells were transfected with negative control (NC), expRNA-LOX-1, siRNA-LOX-1, or expRNA-LOX-1 combined with PD98059. Western blotting assessed ERK, p-ERK, and LOX-1 levels, followed by densitometric quantification to evaluate MAPK/ERK signaling activation and the impact of LOX-1 modulation. (B) After transfection for 24 h, HepG2 cells were treated with 10% HS for 12 h, and the supernatant was collected. The concentrations of TC, TG, and LDL were measured using an autoanalyzer to assess lipid secretion in response to LOX-1 overexpression and activation of the MAPK/ERK pathway. (C) LO2 cells were treated as described in panel (B), and lipid concentrations in the supernatant were measured to further investigate the effect of LOX-1 and the MAPK/ERK pathway on lipid metabolism in different hepatic cell lines. (D) Illustrative Oil Red O-stained images (scale bar = 200 μm) accompanied by quantification of lipid droplets in HepG2, Huh7, and LO2 cells. This experiment was conducted to assess intracellular lipid accumulation in response to LOX-1 overexpression and MAPK/ERK pathway activation. (E) HepG2, Huh7, and LO2 cells were incubated with LDL-DyLight 550 for 3.5 h. Fluorescence-based imaging results and quantification of LDL accumulation within HepG2, Huh7, and LO2 cells are shown (scale bar = 100 μm). The LDL was labeled with red fluorescence. The results demonstrate that LOX-1 overexpression enhances LDL uptake, which is linked to lipid accumulation in these cells. *P < 0.05, **P < 0.01, and ***P < 0.001
Fig. 6
Fig. 6
Overexpression of PPP2CB and LOX-1 significantly activates the MAPK/ERK signaling pathway. (A) LO2 cells were transfected with negative control (NC), expRNA-PPP2CB, siRNA-PPP2CB, expRNA-LOX-1, and siRNA-LOX-1 respectively. Western blotting was performed to confirm the protein expression levels of PPP2CB, LOX-1, p-ERK, and ERK. The ratio of p-ERK/ERK was quantified using ImageJ to assess MAPK/ERK pathway. (B) At 24 h post-transfection, HepG2 cells were treated with 10% HS for 12 h. TC, TG, and LDL concentrations in the culture supernatant were measured using an autoanalyzer. (C) LO2 cells were treated under the same conditions in panel (B), and supernatant lipid levels were assessed to validate the effects of PPP2CB and LOX-1 overexpression in a different hepatic cell line. (D) Oil Red O staining images (scale bar = 200 μm) and lipid droplet quantification are shown for HepG2, Huh7, and LO2 cells. This experiment was designed to assess the intracellular lipid buildup within cells overexpressing PPP2CB and LOX-1, as well as to determine the impact of MAPK/ERK activation on lipid storage. (E) HepG2, Huh7, and LO2 cells were incubated with LDL (LDL-DyLight 550) for 3.5 h. Red fluorescence indicates LDL uptake. Representative fluorescence images and quantification of intracellular LDL accumulation are shown (scale bar = 100 μm); *P < 0.05, **P < 0.01, and ***P < 0.001

Similar articles

References

    1. Collaborators GBDCoD. Global, regional, and National age-sex-specific mortality for 282 causes of death in 195 countries and territories, 1980–2017: a systematic analysis for the global burden of disease study 2017. Lancet. 2018;392(10159):1736–88. - PMC - PubMed
    1. Julius U. History of lipidology and lipoprotein apheresis. Atheroscler Suppl. 2017;30:1–8. - PubMed
    1. Chistiakov DA, Melnichenko AA, Myasoedova VA, Grechko AV, Orekhov AN. Mechanisms of foam cell formation in atherosclerosis. J Mol Med (Berl). 2017;95(11):1153–65. - PubMed
    1. Cui Y, Liu J, Huang C, Zhao B. Moxibustion at CV4 alleviates atherosclerotic lesions through activation of the LXRalpha/ABCA1 pathway in apolipoprotein-E-deficient mice. Acupunct Med. 2019;37(4):237–43. - PMC - PubMed
    1. Wang Y, Ding WX, Li T. Cholesterol and bile acid-mediated regulation of autophagy in fatty liver diseases and atherosclerosis. Biochim Biophys Acta Mol Cell Biol Lipids. 2018;1863(7):726–33. - PMC - PubMed

MeSH terms