. 2025 Jul 3;20(1):78.
doi: 10.1186/s13062-025-00674-3.

Prognostic model integrating histology, systemic inflammation, and recurrence status predicts immunotherapy response in advanced non-small-cell lung cancer patients

Affiliations

Prognostic model integrating histology, systemic inflammation, and recurrence status predicts immunotherapy response in advanced non-small-cell lung cancer patients

F V Moiseenko et al. Biol Direct. .

Abstract

Background: Non-small-cell lung cancer (NSCLC) exhibits variable outcomes and remains a leading cause of cancer-related mortality, despite advances in immunotherapy. This study aimed to develop a prognostic model using real-world data (RWD) to stratify patients by survival outcomes and evaluate the benefit of immunotherapy across risk groups.

Methods: A retrospective cohort of 270 patients with NSCLC (2015-2024) treated with chemotherapy alone (54%) or chemoimmunotherapy (46%) was analyzed. Clinical, laboratory (neutrophil-to-lymphocyte ratio [NLR], platelet-to-lymphocyte ratio [PLR], monocyte-to-lymphocyte ratio [MLR]), and histopathological data were collected. Multivariate Cox regression identified prognostic factors for overall survival (OS) and validated them via bootstrapping.

Results: The cohort (median age, 65; 78% male) had a median OS of 11.2 months and a median progression-free survival (PFS) of 7.7 months. The final prognostic model incorporated histology (adenocarcinoma vs. large cell/squamous cell carcinoma/rare subtypes: HR = 1.6-2.03), recurrence state (HR = 0.51), and NLR (HR = 1.13). Patients were stratified into low- (median OS = 14.6 months) and high-risk (median OS = 9.6 months; p < 0.001) groups. Immunotherapy significantly increased PFS in low-risk patients (12.2 vs. 7.1 months, p = 0.002) and showed an increasing trend in OS (16.9 vs. 11.3 months, p = 0.12). High-risk patients derived no OS/PFS benefit (p ≥ 0.56).

Conclusion: This RWD-derived prognostic model effectively stratifies NSCLC patients into distinct risk groups. Immunotherapy-chemotherapy provided meaningful PFS improvement in low-risk patients but minimal benefit in high-risk subgroups, underscoring the need for tailored therapeutic strategies.

Keywords: Immunotherapy; NLR; Non-small-cell lung cancer; Prognostic model.


Conflict of interest statement

Declarations. Ethics approval and consent to participate: This retrospective study included 270 patients with NSCLC from a database of N.P. Napalkov St. Petersburg Clinical Research and Practical Center of Specialized Types of Medical Care (Oncological). The study protocol was approved by the Ethics Committee of this Center (Approval No. 4 from 14.03.2023). Informed consent was waived due to the retrospective nature of the study design. Competing interests: The authors declare no competing interests. Clinical trial number: Not applicable.

Figures

Fig. 1
Fig. 1
Flowchart of data analysis and patient risk group stratification. The flowchart outlines a survival analysis process for non-small-cell lung cancer (NSCLC) patients at CRPCSTMC (2015–2024). It begins with cohort identification, including patients treated with chemotherapy/combined therapy, excluding those with undefined strategies, incomplete survival data, neuroendocrine tumors, or missing biomarkers: neutrophils (NEU), lymphocytes (LYMP), platelets (PLT), and monocytes (MONO). Data preprocessing and exploratory analysis are followed by univariable Cox regression to screen prognostic variables. Variable selection involves testing proportional hazards assumptions, influential observations, and non-linearity. A multivariable Cox model is then built, validated via bootstrap calibration plots, and visualized as a nomogram. Patients are stratified into low- and high-risk groups (n = 135 each), with survival analysis comparing treatment strategies between groups. The stratification and survival analysis are validated by bootstrap resampling of the study dataset (B = 500)
Fig. 2
Fig. 2
Kaplan-Meier survival analysis of NSCLC patients. (A) Overall survival (OS) for the entire cohort. (B) Progression-free survival (PFS) for the entire cohort. (C) OS stratified by treatment group: Chemotherapy (red) vs. Chemotherapy + Immune Checkpoint Inhibitors (ICI) (blue). (D) PFS stratified by treatment group: Chemotherapy (red) vs. Chemotherapy + ICI (blue). Numbers at risk at specified time points are listed below each panel. Red and blue “+” symbols denote censored data. Log-rank test P values are reported for treatment comparisons (C and D)
Fig. 3
Fig. 3
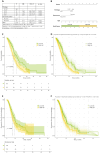
Multivariable Cox model development and risk stratification for NSCLC patients. (A) Multivariable Cox proportional hazards model. Table displaying hazard ratios (HR) with 95% confidence intervals (CI) and P values for predictors of overall survival (OS) in NSCLC patients. (B) Nomogram for risk calculation: total points (median cutoff) stratify patients into low-risk (green) and high-risk (yellow) groups. (C) Kaplan–Meier curves of OS in the low- and high-risk groups. Censored data marked as vertical ticks. (D) Bootstrap validation of survival analysis. Distribution of 500 bootstrapped Kaplan-Meier curves (thin lines) with average survival estimates (bold lines) for risk groups. Proportion of significant log-rank tests (p < 0.05) = 93.4% (95% CI: 90.8–95.2%) confirms the robustness of risk stratification. (E) Kaplan–Meier curves of progression-free survival in the low- and high-risk groups. Censored data are marked as vertical ticks. (F) The bootstrap validation of survival analysis. Distribution of 500 bootstrapped Kaplan-Meier curves (thin lines) with average progression-free survival estimates (bold lines) for risk groups. Proportion of significant log-rank tests (p < 0.05) = 93.4% (95% CI: 90.8–95.2%) confirms the robustness of risk stratification
Fig. 4
Fig. 4
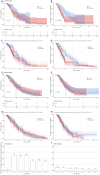
Risk-stratified survival analysis and treatment benefit validation in non-small-cell lung cancer patients. Panels A-B (Low-risk group): Kaplan-Meier curves for (A) overall survival (OS) and (B) progression-free survival (PFS) comparing ICI + Chemo vs. Chemo alone. Panels C-D (Low-risk validation): Bootstrap internal validation (B = 500 iterations) of treatment benefit (ICI + Chemo vs. Chemo) for (C) OS and (D) PFS. Panels E-F (High-risk group): Kaplan-Meier curves for (E) OS and (F) PFS in high-risk patients. Panels G-H (High-risk validation): Bootstrap validation (B = 500) of treatment effect stability for (G) OS and (H) PFS. Panels I-J (Time-restricted survival analysis): Proportion of significant log-rank tests (p < 0.05) at predefined time points for (I) low-risk and (J) high-risk groups. Abbreviations: ICI = Immune checkpoint inhibitors; Chemo = Chemotherapy; OS = Overall survival; PFS = Progression-free survival
Fig. 5
Fig. 5
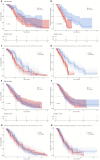
Risk-stratified survival analysis and treatment benefit validation in stage III-IV non-small-cell lung cancer patients. Panels A-B (Low-risk group): Kaplan-Meier curves for (A) overall survival (OS) and (B) progression-free survival (PFS) comparing ICI + Chemo vs. Chemo alone. Panels C-D (Low-risk validation): Bootstrap internal validation (B = 500 iterations) of treatment benefit (ICI + Chemo vs. Chemo) for (C) OS and (D) PFS. Panels E-F (High-risk group): Kaplan-Meier curves for (E) OS and (F) PFS in high-risk patients. Panels G-H (High-risk validation): Bootstrap validation (B = 500) of treatment effect stability for (G) OS and (H) PFS. Abbreviations: ICI = Immune checkpoint inhibitors; Chemo = Chemotherapy; OS = Overall survival; PFS = Progression-free survival

References

    1. Stanley KE. Prognostic factors for survival in patients with inoperable lung Cancer. J Natl Cancer Inst. 1980;65:25–32. - PubMed
    1. Hoang T, Xu R, Schiller JH, Bonomi P, Johnson DH. Clinical model to predict survival in chemonaive patients with advanced Non-Small-Cell lung Cancer treated with Third-Generation chemotherapy regimens based on Eastern cooperative oncology group data. J Clin Oncol. 2005;23:175–83. - PubMed
    1. Heng DYC, Xie W, Regan MM, Warren MA, Golshayan AR, Sahi C, Eigl BJ, Ruether JD, Cheng T, North S, et al. Prognostic factors for overall survival in patients with metastatic renal cell carcinoma treated with vascular endothelial growth Factor-Targeted agents: results from a large, multicenter study. J Clin Oncol. 2009;27:5794–9. - PubMed
    1. Lukka H, Warde P, Pickles T, Morton G, Brundage M, Souhami L. Canadian GU radiation oncologist group controversies in prostate Cancer radiotherapy: consensus development. Can J Urol. 2001;8:1314–22. - PubMed
    1. Rodríguez-Abreu D, Powell SF, Hochmair MJ, Gadgeel S, Esteban E, Felip E, Speranza G, De Angelis F, Dómine M, Cheng SY, et al. Pemetrexed plus platinum with or without pembrolizumab in patients with previously untreated metastatic nonsquamous NSCLC: Protocol-Specified final analysis from KEYNOTE-189. Ann Oncol. 2021;32:881–95. - PubMed

LinkOut - more resources