

Advanced High-Throughput Root Phenotyping and GWAS Identifies Key Genomic Regions in Cowpea During Vegetative Growth Stage
- PMID: 40611537
- PMCID: PMC12232088
- DOI: 10.1111/ppl.70375
Advanced High-Throughput Root Phenotyping and GWAS Identifies Key Genomic Regions in Cowpea During Vegetative Growth Stage
Abstract
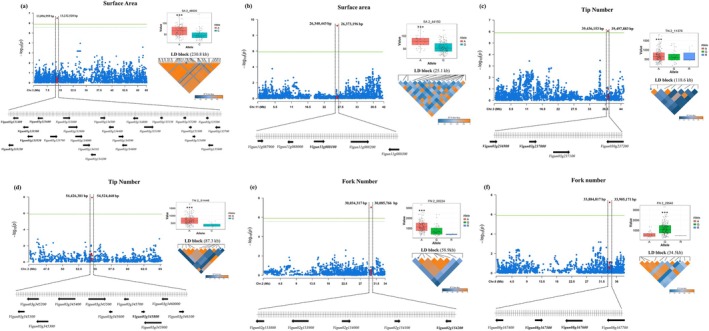
Improving crop production in changing environments can be achieved through selective breeding; however, limited advanced root phenotyping and genotyping in early growth stages hinder assessing root architecture variation and diversity, despite its importance. Therefore, this study utilized advanced image phenotyping on a diverse set of 222 cowpea accessions, revealing significant variations in key phenotypic traits and the genomic regions influencing them. Our study revealed a total of 55 genes linked to major root traits. Among eight root traits-total root length (TRL), surface area (SA), average diameter (AD), root volume (RV), tip number (TN), fork number (FN), primary root length (PRL), and lateral root length (LRL), analyzed, seven significant single nucleotide polymorphisms (SNPs) demonstrated particularly strong associations with three key traits, including surface area (SA), tip number (TN), and fork number (FN). SA emerged as a significant trait, exhibiting considerable variation across the studied accessions. The mean SA was 59.59 cm2, with some genotypes surpassing 140.72 cm2. Further analysis identified two SNPs that showed significant association with SA, located on two distinct chromosomes: 3 and 11. Similarly, two significant SNPs associated with TN were found on chromosome 3, while three SNPs associated with FN were identified on chromosomes 2, 3, and 8. These findings significantly advance our understanding of the genetic foundations underlying important phenotypic traits in cowpeas, offering a robust framework for future genetic improvement initiatives. The results strongly suggest that implementing breeding programs focused on selecting root phenotypes could significantly enhance cowpea productivity across various environments.
Keywords: Vigna unguiculata; advance phenotyping; genotyping; root architecture; single nucleotide polymorphisms.
© 2025 The Author(s). Physiologia Plantarum published by John Wiley & Sons Ltd on behalf of Scandinavian Plant Physiology Society.
Figures


References
-
- Adu, M. O. , Asare P. A., Yawson D. O., et al. 2019. “Identifying Key Contributing Root System Traits to Genetic Diversity in Field‐Grown Cowpea (<styled-content style="fixed-case"> Vigna unguiculata </styled-content> L. Walp.) Genotypes.” Field Crops Research 232: 106–118.
-
- Arias‐Baldrich, C. , de la Osa C., Bosch N., Ruiz‐Ballesta I., Monreal J. A., and García‐Mauriño S.. 2017. “Enzymatic Activity, Gene Expression and Posttranslational Modifications of Photosynthetic and Non‐Photosynthetic Phosphoenolpyruvate Carboxylase in Ammonium‐Stressed Sorghum Plants.” Journal of Plant Physiology 214: 39–47. - PubMed
-
- Banaś, A. K. , Aggarwal C., Łabuz J., Sztatelman O., and Gabryś H.. 2012. “Blue Light Signalling in Chloroplast Movements.” Journal of Experimental Botany 63: 1559–1574. - PubMed
-
- Bradbury, P. J. , Zhang Z., Kroon D. E., Casstevens T. M., Ramdoss Y., and Buckler E. S.. 2007. “TASSEL: Software for Association Mapping of Complex Traits in Diverse Samples.” Bioinformatics 23: 2633–2635. - PubMed
-
- Burridge, J. D. , Schneider H. M., Huynh B. L., Roberts P. A., Bucksch A., and Lynch J. P.. 2017. “Genome‐Wide Association Mapping and Agronomic Impact of Cowpea Root Architecture.” Theoretical and Applied Genetics 130: 419–431. - PubMed
MeSH terms
Grants and funding
LinkOut - more resources
Full Text Sources
Miscellaneous
