[Preprint]. 2025 Jun 19:2025.06.16.658716.
doi: 10.1101/2025.06.16.658716.

The Spatial Atlas of Human Anatomy (SAHA): A Multimodal Subcellular-Resolution Reference Across Human Organs

Affiliations

The Spatial Atlas of Human Anatomy (SAHA): A Multimodal Subcellular-Resolution Reference Across Human Organs

Jiwoon Park et al. bioRxiv. .

Abstract

The Spatial Atlas of Human Anatomy (SAHA) represents the first multimodal, subcellular-resolution reference of healthy adult human tissues across multiple organ systems. Integrating spatial transcriptomics, proteomics, and histological features across over 15 million cells from more than 100 donors, SAHA maps conserved and organ-specific cellular niches in gastrointestinal and immune tissues. High-resolution profiling using CosMx SMI, 10x Xenium, RNAscope, GeoMx DSP, and single-nucleus RNA-seq reveals spatially organized cell states, rare adaptive immune populations, and tissue-specific cell-cell interactions. Comparative analyses with colorectal cancer and inflammatory bowel disease demonstrate the power of SAHA to detect disease-associated spatial disruptions, including crypt dedifferentiation, perineural invasion, and therapy-resistant immune remodeling. All data are openly accessible through a FAIR-compliant interactive portal to support exploration, benchmarking, and machine learning model training. Through SAHA, we provide a foundational framework for spatial diagnostics and next-generation precision medicine grounded in a comprehensive human tissue atlas.


Figures

Extended Data Fig. 1:
Extended Data Fig. 1:. SAHA project workflow and data generation pipeline.
Overview of tissue collection, sample preparation, multimodal spatial profiling (CosMx, Xenium, GeoMx, RNAscope, snPATHO-seq), data integration, and open-access portal deployment.
Extended Data Fig. 2:
Extended Data Fig. 2:. Detailed Cell Types Identified from SAHA.
a, UMAP projections colored by detailed cell-type annotations derived from canonical marker gene expression. b, Stacked bar charts showing detailed cell-type composition across sections and the relative abundance of epithelial, immune, stromal, and neuronal subtypes. c, Organ-specific distribution of broad cell types (epithelial, immune, stromal, neuronal, etc.).
Extended Data Fig. 3:
Extended Data Fig. 3:. Overall Quality Assessment of SAHA Data.
a, Representative RNAscope segmentation and quantification results. b, Comparison of RNAscope mean transcript counts of control probe PPIB (left) versus CosMx RNA mean counts for matched samples (right). c, Correlation analyses (Spearman’s ρ, top) and Bland-Altman plots (bottom) assessing agreement between RNAscope and CosMx measurements. CosMx RNA mean counts (left) and CosMx RNA feature counts (right) across samples were compared, and each dot represents a sample. Grey dashed lines represent the linear regression fit with shaded areas indicating the 95% confidence intervals. For Bland-Altman analysis, the x-axis represents the mean of the two measurements, and the y-axis shows the difference (CosMx – RNAscope), where each sample is labeled with its sample ID number, and the grey dashed line indicates the mean difference (bias), and red dashed lines indicate the 95% limits of agreement (mean ± 1.96 × SD). d, Quality control metrics compared across gastrointestinal organ cohorts, demonstrating consistent assay performance.
Extended Data Fig. 4:
Extended Data Fig. 4:. Spatial mapping of lymphoid structures and cellular neighborhoods in the appendix.
a, Spatial expression patterns of highly variable genes (IGHA1, IGKC, CD74, CCL21) highlighting lymphoid structures in SAHA APE as an example. b, Spatial projections of cellular neighborhoods and detailed cell types across representative fields of view (FOVs) in SAHA APE, colored by cell type and spatial neighborhoods (left); representative spatial projection of lymphoid structure showing distributions of spatial neighborhoods (middle) and broad and granular cell types (right) in a single FOV.
Extended Data Fig. 5:
Extended Data Fig. 5:. Cellular diversity and spatial neighborhood organization in SAHA lymph nodes.
a, UMAP embeddings of SAHA LN B cell niches (left) and transcriptionally defined cell types (right), including Lymphoid-B, Follicular B, Plasma subsets, and stromal components. b, Heatmap showing normalized expression (z-score) of B cell and plasma cell marker genes across annotated LN cell types, highlighting class-switching and activation gradients. c, Spatial projections of LN section showing annotated GC and peri-GC regions used for niche comparison. Cells not used in GC analysis are shaded in gray. d, Cell-cell interaction matrices stratified by cell types revealing distinct interaction patterns in germinal center, relative to Fig. 4d. e, Expression projections of selected differentially expressed genes in GC vs. peri-GC cells. f, Volcano plot comparing GC vs. peri-GC B cells in LN, showing significantly upregulated (red) and downregulated (blue) genes. g, Spatial projections of colon (top) and LN (bottom) samples colored by broad cell type annotations. h, UpSet plot showing intersecting gene sets between differentially expressed genes (DEGs) and spatially variable genes across LN and colon GC niches. Shared and unique signatures highlight conserved and tissue-specific B cell programs.
Extended Data Fig. 6:
Extended Data Fig. 6:. Spatial network architecture and immune-epithelial interactions across gastrointestinal tissues.
a, Spatial network statistics (average clustering coefficient, closeness centrality, degree centrality) across SAHA APE, ILE, COL, and STO tissues. b, Co-occurrence analysis of epithelial cells with other cell types within crypt-associated regions. c, Top ligand–receptor interactions between immune and epithelial cells within lymphoid structures. d, Comparison of various spatial neighborhood clustering methods across APE, ILE, and COL crypt structures. e, Significant immune-epithelial ligand-receptor interactions across gastrointestinal organs.
Extended Data Fig. 7:
Extended Data Fig. 7:. Comparison of RNA and protein expression across tissues and validation of annotation consistency.
a, Hierarchical cell type classification scheme used for protein-based phenotyping with SciMap. b, Cell type proportions across major organs based on protein-based annotations. c, Comparison of cell type assignments from RNA (top) and protein (bottom) data from Fig. 5c. d, Label concordance between MaxFuse-integrated annotations and SciMap gating-based annotations confirming consistent cell type classification across platforms. e, Scatter plots of average RNA versus protein expression across matched genes for each organ, showing tissue-specific correlation patterns. Each dot represents a gene with paired RNA and protein measurements; red line indicates linear regression, and shaded area denotes 95% confidence interval. f, Zoomed-in views for representative genes with different RNA–protein concordance profiles.
Extended Data Fig. 8:
Extended Data Fig. 8:. Integrated spatial annotation and cell-type resolution in CRC and SAHA COL samples.
a, Violin plots showing the raw distribution of detected features and counts across CRC and SAHA COL samples. b, Dot plot of cell-type specific marker genes used for annotation in the integrated dataset of CRC and SAHA COL samples. Dot size corresponds to the percentage of cells within a cluster expressing the gene, and the color represents the scaled gene expression level. Clusters labeled “mixed” and “Epithelial_tcell” include expression patterns that may represent multiple cell types likely due to segmentation artifacts. c, Bar plots showing the overall percentage and the number of cells across CRC and SAHA COL. d, Representative FOVs from CRC and SAHA COL, colored by cell types from panel c. e, Expression maps showing examples of CRC-enriched spatially variable genes identified in Fig. 7e. Expression of REG1A and MX1 is shown across CRC and SAHA COL FOVs. f, UMAP projection of CRC sample (n=1), colored by the cell types. g, Dot plot of marker genes used to identify CRC clusters. Dot size corresponds to the percentage of cells expressing the gene within each cluster and color shows the scaled expression value. h, Perineural invasion (PNI) FOV clustered independently to resolve fibroblast subtypes. Close-contact fibroblasts adjacent to the nerve are distinguished (purple) from other fibroblast populations (red).
Extended Data Fig. 9:
Extended Data Fig. 9:. Cell-type level comparisons between SAHA healthy ileum and IBD tissues.
a, Spearman correlation matrix of cell-type average expression profiles between 1000-plex (lower-plex) and 6000-plex (higher-plex) CosMx RNA datasets, clustered by broad and detailed cell types. Higher correlation values indicate consistent cell-type transcriptional programs across datasets. b, UMAP embedding of detailed cell-type annotations derived from CosMx RNA profiling, colored by cell type. c, Heatmap showing relative cell-type composition across individual samples from healthy ileum (ILE) and IBD tissues, stratified by sample ID. d, Stacked bar plots summarizing cell-type composition aggregated by clinical condition (healthy ileum, IBD responder, IBD non-responder), highlighting changes in epithelial, immune, and stromal populations between healthy and disease states.
Figure 1:
Figure 1:. Overview of SAHA Workflow and Data Scope.
a, Schematic overview of SAHA resource, summarizing sample collection and spatial profiles. The diagram illustrates the scale of (1) cohort, (2) organ types, (3) batches, (4) cells, and (5) biomolecules profiled across multiple platforms and modalities. b, Heatmap showing the SAHA sample (healthy tissues) demographics across profiled organs, colored by age, sex, and ethnicity, with missing information labeled as unknown in gray. c, Distribution of total cell numbers across healthy and diseased tissues stratified by technology and organ type; top right corner shows the summary of spatial technologies deployed (CosMx RNA and Protein, Xenium, GeoMx, RNAscope, H&E) with representative images from the same section in each category labeled with the same color. d, Comparative overview of the published spatial atlases and SAHA by number of cells profiled, organ coverage, and assay modality (x axis). The dot size indicates the number of cells, and the colour indicates the maximum number of genes in the panel.
Figure 2:
Figure 2:. Key Structures, Cell Types, and Cellular Networks across SAHA Organs.
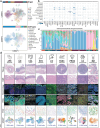
a, UMAP embeddings (n = 2,865,647 cells) colored by organ (top) or broad cell type (bottom). b, Stacked violin plots showing canonical marker genes across major cell types, with color intensity reflecting median expression level. c, Stacked bar chart summarizing the broad cell-type composition per section, illustrating the relative abundances of epithelial, immune, stromal, and neuronal cells. d, Representative histological (H&E) sections, spatial RNA and protein images, and organ-specific UMAP embeddings from each tissue, demonstrating subcellular resolution and morphological context.
Figure 3:
Figure 3:. Spatial Neighborhoods and Cellular Niches of the Crypt.
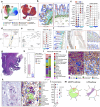
a, Representative colon cross-section, showing spatially resolved cell types (colors represent cell types) across the mucosa, submucosa, and muscularis layers. Graphs to the right display the expression of key markers (e.g., PIGR, MHC-I, ACTA2) stratified by tissue depth. b, Spatial enrichment scores of key biological pathways (keratinization, antigen processing, smooth muscle contraction) stratified by tissue depth. c, Spatial mapping of proliferative and stress-response gene expressions (i.e., CDKN1A, CCND1, TFEB, and SMARCB1) within a magnified region at crypt boundaries. d, Dot plot of enriched immune-epithelial crosstalk represented by ligand-receptor interactions from the crypt tip niche, sized by −log2 p-value. e, Segmented overlays and heatmaps depicting cell type composition (e.g., strong T- and B-cell predominance near crypts, variable mesenchymal content deeper in the colon wall) across different tissue layers. f, Cell type enrichment comparisons across all colon sections (left) and selected crypt regions, including colon cross-section (middle) and crypt tips (right). g, Spatial projection of large lymphoid aggregates in SAHA APE, color-coded by cell type. h, Force-directed graph showing adjacency networks among immune and stromal cells within lymphoid aggregates. i, Spatial projections of cell types by both broad and detailed annotations, highlighting specialized immune subtypes (e.g., T follicular helper) and their heterogeneity. j, Chord diagram and heatmaps of global and niche-specific ligand-receptor interactions, The left panels indicate overall interaction frequency among major cell types, while the right panels focus on specialized niches (e.g., lymphoid structures identified from APE).
Figure 4:
Figure 4:. Comparison of Spatial Neighborhoods and Cellular Niches across Organs.
a, Representative spatial mapping of lymphoid structures in SAHA lymph node (LN) samples, showing transcriptionally defined niches and cell type composition. b, Bar plots comparing the proportion of B cells across “in GC (or lymphoid structure for appendix)” and “around GC” niches in LN and appendix (APE). c, Spatial expression plots of canonical B cell markers (MS4A1, IGHG1) in LN and APE, illustrating organ-specific localization and expression intensity. d, Cell-cell interaction matrices stratified by spatial niche showing overall interaction patterns around germinal centers. e, Pathway enrichment analysis of genes shared between LN and APE that are both differentially expressed and spatially autocorrelated, showing enrichment for immune and follicular activation processes. f, Top enriched pathways among APE-specific spatially variable DEGs, highlighting epithelial signaling and extracellular remodeling. g, UMAP embedding of integrated gastrointestinal spatial datasets (APE, ILE, COL, STO), colored by tissue of origin and spatial neighborhood clusters. h, Representative spatial projections showing neighborhood clustering across organs. Colors represent unbiased spatial clustering involving epithelial, immune, and stromal compartments. i, Network graph illustrating relationships among organs, spatial neighborhood clusters, and broad cell types. Nodes represent variables (organ, spatial cluster, and cell type), colors of the edges represent edge weights (spatial connectivities), and the distance between nodes represents expression-level correlation. j, Stacked bar chart of organ-specific distributions of spatial neighborhoods, where colors represent unbiased spatial clusters shown in g-h. k, Relative frequencies of selected niche clusters, highlighting shared and organ-restricted spatial patterns; colors represent cell types. l, Expression level (top) and spatial autocorrelation (bottom) comparison of selected genes across spatial neighborhoods, illustrating spatial heterogeneity and functional specialization within gastrointestinal tissue clusters.
Figure 5:
Figure 5:. Integration of Spatial Proteomics Data for Multi-omics Map
a, UMAP projection of normal SAHA spatial proteomics datasets from normal tissues following integration. Data are colored by tissue of origin (left), cell type labels using protein information (middle), and labels done with both RNA and protein information (right). b, Heatmap of protein expression of RNA-derived cell type labels, showing canonical and cross-modality marker distributions. c, Comparison of cell type assignments from RNA (top) and protein (bottom) datasets in representative fields of view. d, Representative spatial images from SAHA PROS, APE, and STO tissues, comparing RNA-based (top) and protein-based (bottom) cell type assignments from the same fields of view. e, Validation of ligand-receptor analysis using spatially resolved protein imaging, where protein expression of key immune markers (e.g., CCR7, HLA-DRA, CD4) overlaid on tissue sections (left) and ligand–receptor pair contributions based on spatially restricted analysis within selected regions (right) were shown. f, Correlation plot of average RNA and protein expressions across overlapping markers..
Figure 6:
Figure 6:. Integration of Matched Histopathological imaging with Transcriptomics Data using Multimodal Foundation Models
a, Whole-slide H&E image of a representative SAHA slide (APE) showing tiled tissue regions used for feature extraction. b, Schematic overview of the computational workflow: tissue regions are segmented, tesselated, and input to a multimodal foundation model that extracts quantitative morphological features for each region. c, Low-dimensional embedding of image-derived morphological features using Isomap, showing tissue structure captured solely from histological patterns corresponding to morphologically-driven clusters. d, Clustered heatmap of morphological feature embeddings across tissue locations, revealing spatial gradients and local heterogeneity. e, Spatial reconstruction of tissue based on morphological clusters, demonstrating regional organization inferred from morphological features alone. f, UMAP embedding of morphological tile clusters from the gastrointestinal tract (ileum, appendix, colon), with representative histological images from each cluster. g, Organ-wise comparison of morphological clusters (top), annotated with similarity scores to histopathology terms (bottom), revealing conserved structures such as crypts, lymphoid follicles, and extracellular matrix regions. h, Clustered heatmap showing enrichment of histopathological terms (rows) across morphology-derived clusters (columns), highlighting distinct text-derived phenotypes. i, Composition of broad cell types (epithelial, connective, immune), segmented and classified in the histology images, within each morphology-derived cluster, revealing dominant biological compartments. j, Pairwise distance matrix showing spatial proximity between clusters, with warmer colors indicating closer physical co-localization. k, Canonical correlation analysis (CCA) comparing tile-level morphological cluster abundances with RNA-defined cell type abundances, showing correspondence between structure and cell states. l, Example region from an H&E image (top) alongside matched CosMx cell-type annotation (bottom) illustrating alignment between morphological features and transcriptomics.
Figure 7:
Figure 7:. Spatial Heterogeneity in Cellular and Molecular Profiles Across Healthy Crypts from COL and CRC Samples.
a, UMAP projection of integrated healthy SAHA colon samples (SAHA COL, n=3) with colorectal cancer (CRC, n=1) following Harmony integration, colored by cell types (left) and disease status (right). b, Representative spatial images from CRC tumor adjacent and SAHA COL tissues, colored by cell types. c, Gene expression profiles of top and bottom crypt regions in SAHA COL and CRC tumor adjacent samples. Violin plots show normalized expression levels,-colored by disease status. Genes shared between SAHA COL and CRC samples (left) and differentially expressed genes in CRC tumor adjacent crypts (right) are shown. d, K-means clustering of crypt FOVs based on spatially variable genes identified by Moran’s I. Points are colored by sample status and shaded regions denote k-means clusters. e, Comparison of spatially variable genes between CRC tumor adjacent and healthy crypts. Moran’s I correlation plot from a representative CRC vs. SAHA COL FOV comparison (left) are shown, genes with Moran’s I > 0.2 in either condition are highlighted in blue. Dashed red line indicates equal spatial autocorrelation. Violin plots of condition-specific spatial genes are shown (right). f, Spatial expression of IL22RA1 in healthy and CRC tumor adjacent crypts, representative of differentially enriched crypt genes in panel e, shown across normalized assay values; insets shown cell type annotations. g, Intrapatient tumor heterogeneity in CRC sample, where H&E-stained section with annotated regions showing Type 1 (purple) and Type 2 (blue) tumor areas. h, Lymphocyte-to-tumor cell ratio across FOVs, grouped by dominant tumor type calculated by the percentage of B cells and T cells divided by the tumor cell percentage in each FOV. Mixed denotes the FOV samples that have a close percentage of type 1 and type 2 tumor cells. Rest of the dots are colored based on the region of the tumor within the tissue. i, Proportion of immune cell types in Type 1 vs. Type 2 tumor FOVs, colored by cell types that are manually curated. j, Representative FOVs from each tumor type, colored by the cell type. k, Spatial transcriptomics reveals unique perineural invasion (PNI) structure with great detail, demonstrated by H&E image of the corresponding PNI region (left) and spatial projection of cell types, where bright green highlights the glial cells that are surrounded by fibroblasts and tumor glands (right). l, Dot plot of fibroblast markers highlighting the difference between close-contact fibroblasts to the nerve versus rest of the fibroblasts in the data. m, Unique signaling interactions from close fibroblasts (ANGPTL pathway, left) and glial cells (LIFR pathway, right) toward immune and tumor compartments.
Figure 8:
Figure 8:. Application of the SAHA healthy ileum reference to spatially profile IBD tissues and therapeutic response.
a, Schematic overview of comparative analysis using SAHA ILE reference and ileal samples from IBD patients stratified by TNFα inhibitor response (Responder, Non-responder). b, UMAP embeddings of CosMx RNA profiles colored by major cell types (left) and sample identities (right) across healthy ILE and IBD tissues. c, Spatial mapping of cell types in representative IBD and healthy ileum sections, showing increased immune infiltration in IBD tissues. d, Quantification of immune cell proximity to epithelial cells (within 300 μm), demonstrating significantly higher immune infiltration scores in IBD compared to healthy ileum (***p < 0.001). e, Ligand-receptor interaction scores between immune and epithelial cells across IBD responders, non-responders, and healthy ileum, showing elevated spatial signaling in non-responders. f, Violin plot of TNFRSF1A (TNF receptor 1) expression in mesenchymal-stromal cells across IBD responders, non-responders, and healthy ileum (**p < 0.01). g, Spatial projection of TNF-TNFRSF1A ligand-receptor interactions in a representative IBD non-responder sample, highlighting immune–stromal interface activation. h, Represented images of IBD and SAHA ILE samples (left) with UMAP embedding of unsupervised clustering of H&E-stained ileum sections, stratifying normal and IBD tissues based on morphological features (right). i, Combined scores of histological features associated with IBD pathologies in responders and non-responders, including increased crypt branching, immune cell infiltration, and mucosal edema.
Figure 9:
Figure 9:. Impact of SAHA, SAHA Data Portal and Accessibility.
A, (to be updated) Comparison between traditional single-cell transcriptomic profiling (left) and spatial multi-omics profiling integrating morphological information (right), combining H&E staining, cell boundary segmentation, and multiplexed RNA and protein expression profiling (19k whole transcriptome probes + 67-plex protein). b, Overview of cost and scalability considerations for spatial multi-omics at subcellular resolution. c, SAHA data portal architecture, enabling integrated visualization and analysis of spatial multi-omics datasets. The portal supports interactive exploration of spatial transcriptomics and proteomics through UMAP and PCA projections, cell-type annotations, spatial imaging data, gene expression matrices, and downloadable formats including image files, flatfiles, AnnData, and Seurat objects for analysis in Python and R.

References

    1. Palla G., Fischer D. S., Regev A. & Theis F. J. Spatial components of molecular tissue biology. Nat. Biotechnol. 40, 308–318 (2022). - PubMed
    1. Park J. et al. Spatial omics technologies at multimodal and single cell/subcellular level. Genome Biol. 23, 256 (2022). - PMC - PubMed
    1. Rood J. E. et al. The Human Cell Atlas from a cell census to a unified foundation model. Nature 637, 1065–1071 (2025). - PubMed
    1. Rozenblatt-Rosen O. et al. The Human Tumor Atlas Network: Charting Tumor Transitions across Space and Time at Single-Cell Resolution. Cell 181, 236–249 (2020). - PMC - PubMed
    1. Velten B. & Stegle O. Principles and challenges of modeling temporal and spatial omics data. Nat. Methods 20, 1462–1474 (2023). - PubMed

Publication types

LinkOut - more resources