[Preprint]. 2025 Jun 19:2025.06.18.660452.
doi: 10.1101/2025.06.18.660452.

Identification of a conserved RNA structure in the TNFRSF1A 3'UTR: Implications for post-transcriptional regulation

Affiliations

Identification of a conserved RNA structure in the TNFRSF1A 3'UTR: Implications for post-transcriptional regulation

Van S Tompkins et al. bioRxiv. .

Abstract

Tumor necrosis factor receptor superfamily 1A gene (TNFRSF1A) encodes the TNFR1 protein, a critical regulator of inflammation implicated in various diseases. Using ScanFold with the Integrative Genomics Viewer (IGV) GUI, we identified novel RNA structural elements within the TNFRSF1A gene. Focusing on the 3'UTR, these structures were characterized using reporter assays and targeted DMS-MaPseq. We identified a structured region that may play a role in regulating TNFR1 translation and that was also found to associate with HuR, a key regulatory RNA-binding protein. These findings provide a framework for identifying and characterizing potential functional RNA structures in therapeutically relevant genes, suggesting a new layer of post-transcriptional regulation for TNFR1 expression.

Keywords: DMS-MaPseq; HuR; RNA; TNFR1; TNFRSF1A; inflammation; structure probing; translational efficiency; untranslated region (UTR).


Figures

Figure 1.
Figure 1.
ScanFold output for TNFRSF1A gene (A) and transcript (B). Data presented as IGV tracks includes forward window-based calculations of the minimum free energy, z-score, and ensemble diversity (numbers represent low and high values), as well as the z-score-weighted base pairing (arc color represents z-score > 0, >–1, >–2, and ≤−2 color in white/gray, yellow, green, and blue, respectively). The gene schematic in A shows the introns (line) and exons (taller boxes), with demarcation between coding (tallest) and untranslated regions, from the MANE transcript. B shows a representation of this transcript in its spliced form and includes a track for extracted structured regions.
Figure 2.
Figure 2.
Identification of regions in the 3’UTR of TNFRSF1A that alter translational efficiency. A. Schematic of the 3’UTR of TNFRSF1A showing the ScanFold-predicted base pairing (color scheme as in Fig 1). Colored bars below represent regions that were cloned into a dual luciferase reporter construct (see S5 File for backbone) or deleted from the 3’UTR. For the grey bars, the “3u” designation indicates the 3’UTR whereas the “5e” or “3e” indicates the 5’ or 3’ ends, respectively. The numbers represent the ScanFold-identified ≤ −2 structured region that is encompassed. miR-bind regions are those predicted by TargetScan. B. The top portion shows reporter assay results for the relative level of protein (by luminescence; gold) and mRNA (by qPCR; red) after normalization to both a transfection control (Renilla) and empty vector (Vec). Translational efficiency, or protein per mRNA, is shown below. The number (n) of independent data points included per condition is given. The indicated conditions-what was expressed from the 3’UTR-are provided at the bottom. C. Reporter assay results, like B but with notable differences. These are deletion (“d”) constructs where only the indicated region has been removed from the 3’UTR, and these were normalized to the full-length 3’UTR. For both B and C, both asterisks and black bars represent statistically significant (p-value < 0.05; t-test, equal variance, two-tailed) changes from Vec (B) and full-length 3’UTR (C), respectively.
Figure 3.
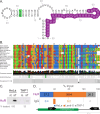
Figure 3.
TNFRSF1A structure 7 (s7) is conserved and is associated with HuR. A. ScanFold s7 model showing the RBPmap-predicted binding region for HuR binding (purple). The covarying pair is indicated with green shading. B. TNFRSF1A s7 is conserved across mammals. Representative sequence sub-alignment of 15 homologous sequences for s7 (from a total of 134 homologous sequences identified). Aligned nucleotides are colored according to identity and are followed by a track showing the consensus sequence data across all 135 mammalian species considered. This is followed by an aligned “dot-bracket” structure that corresponds to the 2D structure represented in A, with the covarying G-C base pair in the first hairpin highlighted green (note the variation in the alignment that yields “consistent mutations” G-C to G-U and “compensatory mutation” from G-C to A-U). The final track indicates nucleotide occupancy at each aligned site, which ranges from 35 to 136 (no gaps). C. Immunoblot results for HuR following biotin pulldown assays using the indicated cell lysates and either s7 or the reverse complement (rc) of s7. Less THP1 sample remained after mass spectrometry, accounting for the unequal loading between cell types. D. Stacked bar graph showing collective RNA immunoprecipitation results as a percentage of input. An antibody that binds HuR or an immunoglobulin isotype control (IgG) from the indicated cell lines were used for immunoprecipitation prior to RNA isolation and RT-qPCR for the region encompassing s7. Schematic at the bottom indicates the relative position of the forward (for) and reverse (rev) primers that were used for detection of s7 (darker green). In graph numbers indicate calculated percent input values. Experiments in B and C were performed once in each of the indicated cell types.
Figure 4.
Figure 4.
Targeted DMS-MaPseq structure probing supports ScanFold models. A. IGV tracks showing the region of the TNFRSF1A transcript covered by targeted structure probing (3’UTR is grey and a truncated coding sequence is dark blue). ScanFold predictions and extracted structures are as previously shown (Fig 1 and 2). DMS reactivities are shown in heatmap form for both HeLa and THP1 cells. DRACO-identified dynamic regions are marked in teal. Models for structures 5, 7, and 9, show the covarying base pairs (green). B. Informed ScanFold structure models from both HeLa and THP1 with hard constraints for covarying base pairs and soft constraints for DMS reactivities (please see Methods).

Similar articles

References

    1. Naismith JH, Devine TQ, Kohno T, Sprang SR. Structures of the extracellular domain of the type I tumor necrosis factor receptor. Structure. 1996;4(11):1251–62. doi: 10.1016/S0969-2126(96)00134-7. - DOI - PubMed
    1. Baker SJ, Reddy EP. Transducers of life and death: TNF receptor superfamily and associated proteins. Oncogene. 1996;12(1):1–9. Epub 1996/01/04. - PubMed
    1. Bajzer Z, Myers AC, Vuk-Pavlović S. Binding, Internalization, and Intracellular Processing of Proteins Interacting with Recycling Receptors: A Kinetic Analysis. Journal of Biological Chemistry. 1989;264(23):13623–31. doi: 10.1016/S0021-9258(18)80042-4. - DOI - PubMed
    1. Caminero A, Comabella M, Montalban X. Role of tumour necrosis factor (TNF)-α and TNFRSF1 R92Q mutation in the pathogenesis of TNF receptor-associated periodic syndrome and multiple sclerosis. Clinical & Experimental Immunology. 2011;166(3):338–45. doi: 10.1111/j.1365-2249.2011.04484.x. - DOI - PMC - PubMed
    1. Fischer R, Kontermann RE, Pfizenmaier K. Selective Targeting of TNF Receptors as a Novel Therapeutic Approach. Frontiers in Cell and Developmental Biology. 2020;8. doi: 10.3389/fcell.2020.00401. - DOI - PMC - PubMed

Publication types

LinkOut - more resources