. 2025 Jun 19:13:1621705.
doi: 10.3389/fcell.2025.1621705. eCollection 2025.

PPP1R12B inhibits cell proliferation by inducing G0/G1 phase arrest via PAK2/β-catenin axis in hepatocellular carcinoma

Affiliations

PPP1R12B inhibits cell proliferation by inducing G0/G1 phase arrest via PAK2/β-catenin axis in hepatocellular carcinoma

Yangqianwen Zhang et al. Front Cell Dev Biol. .

Abstract

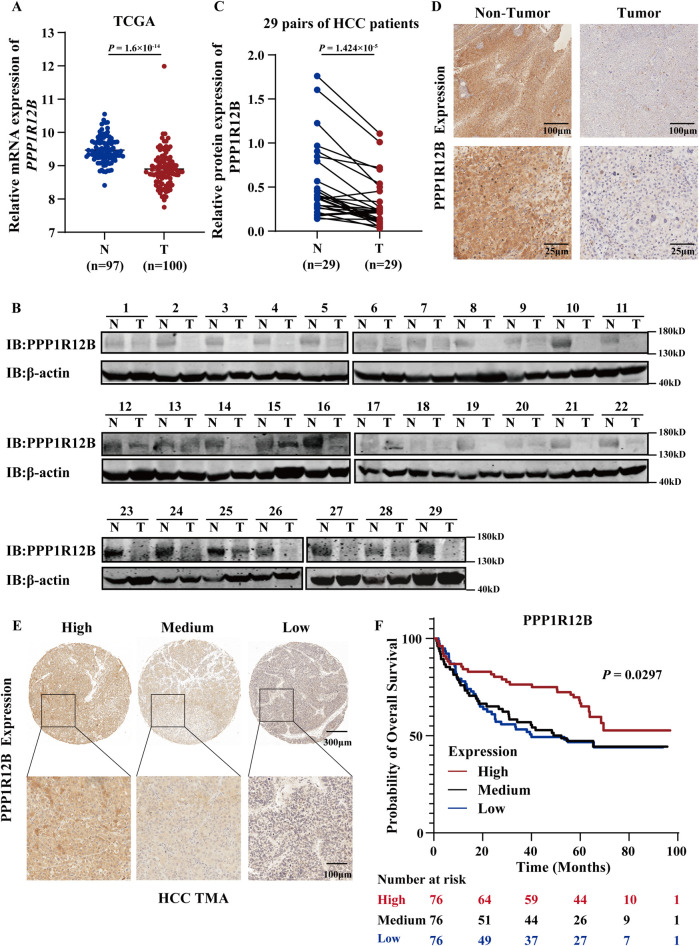
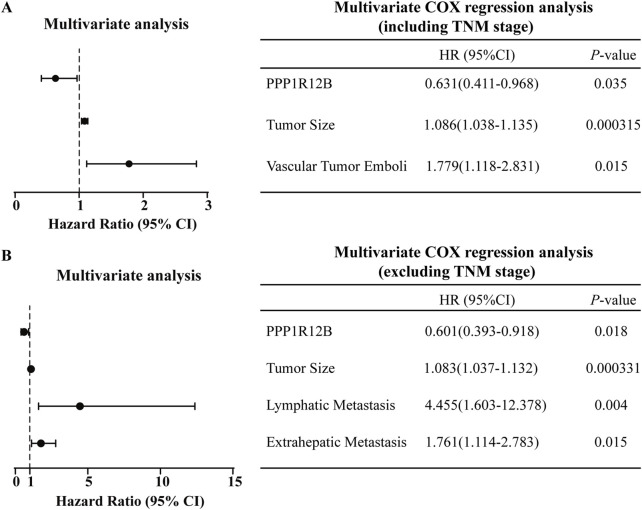
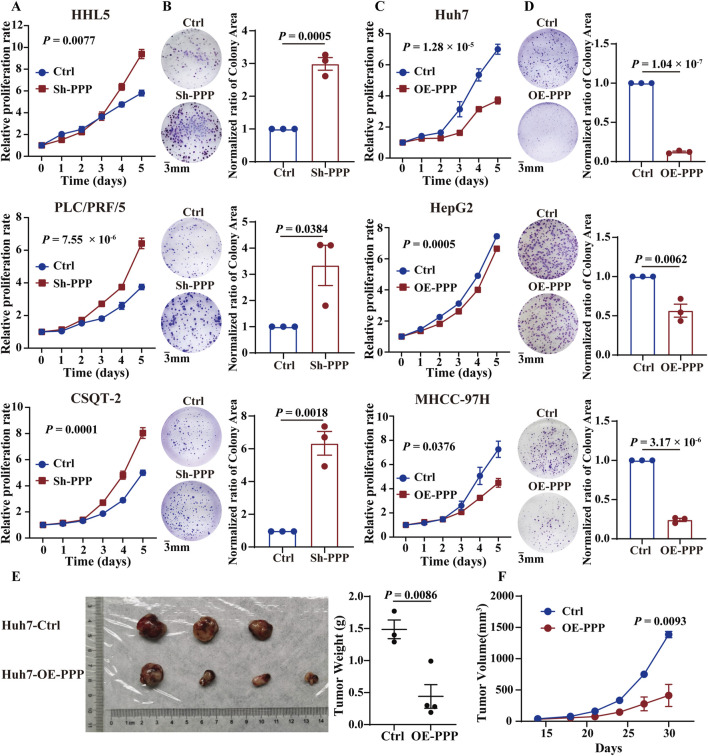
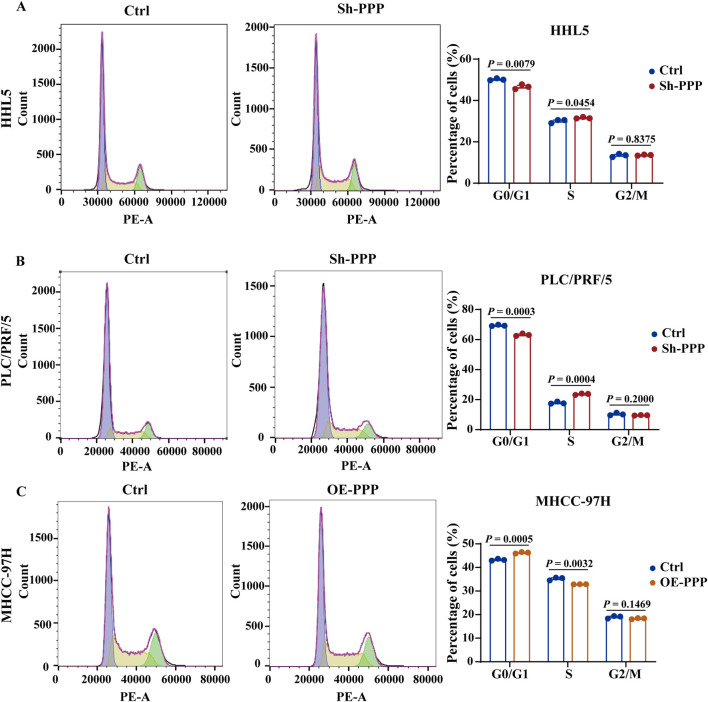
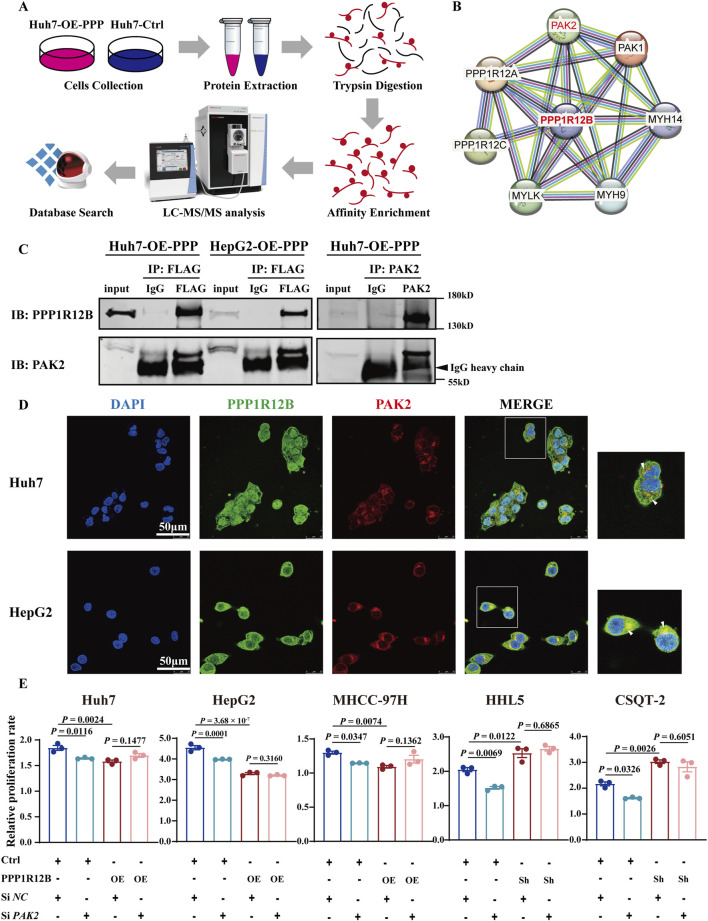
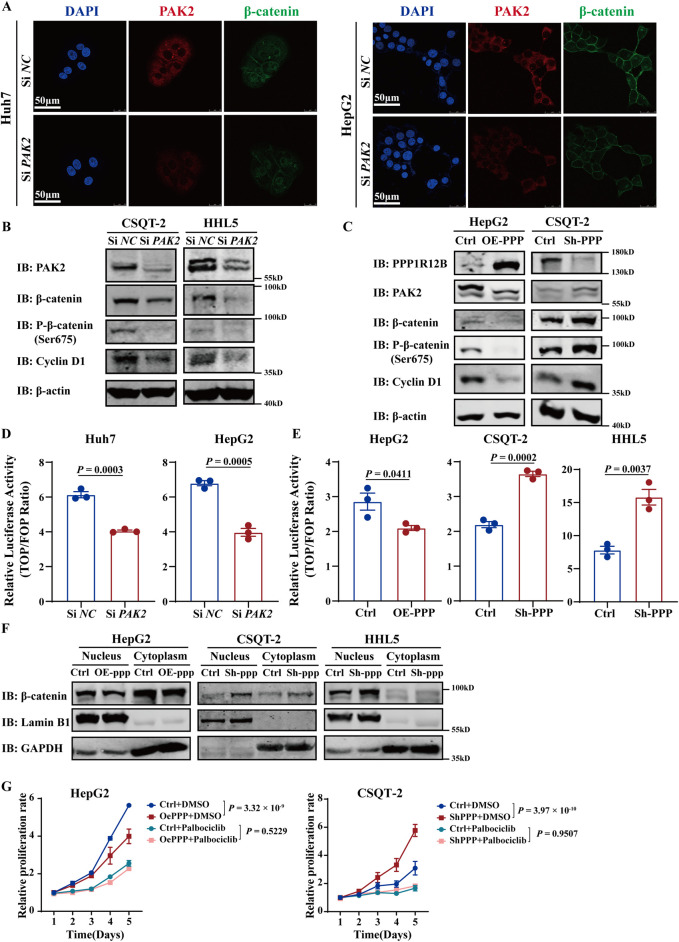
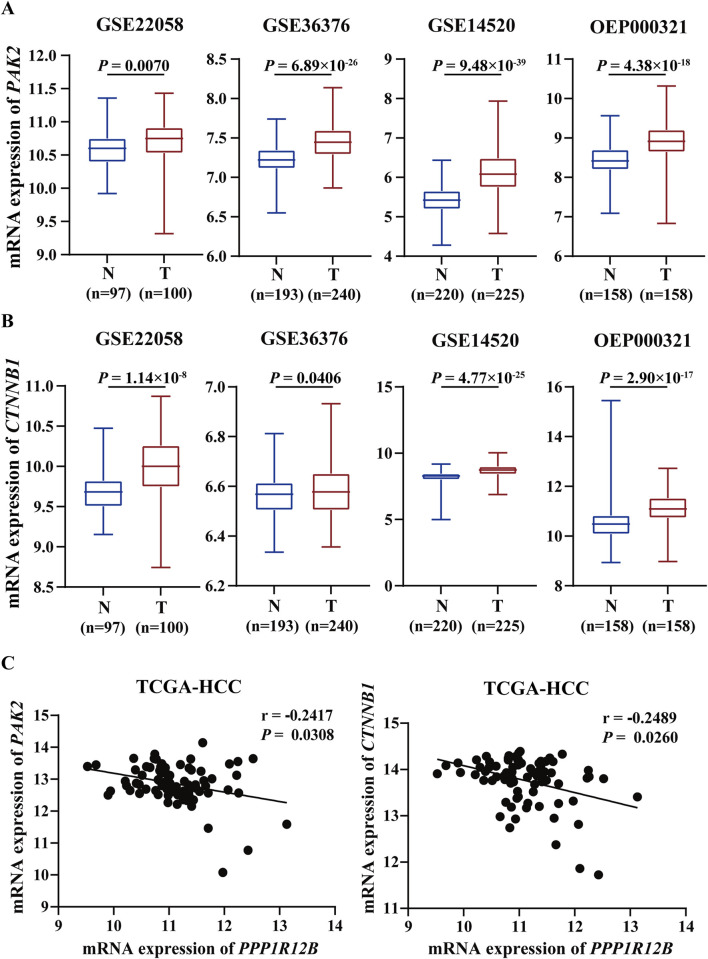
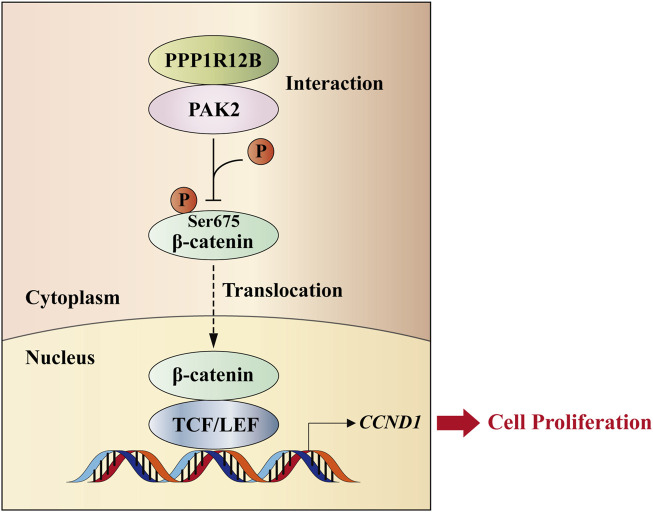
Protein phosphatase 1 regulatory subunit 12B (PPP1R12B) is a regulatory subunit of protein phosphatase 1. While our previous study identified the inhibitory role of PPP1R12B in hepatocellular carcinoma (HCC), the precise molecular mechanisms underlying its anti-proliferative effects remain unclear. Herein, we demonstrated that PPP1R12B expression is significantly downregulated in HCC tissues and serves as an independent prognostic marker for favorable patient outcomes. Additionally, overexpression and silence of PPP1R12B experiments showed that PPP1R12B overexpression restricted cell proliferation and colony formation in vitro, and inhibited xenografted tumor growth in vivo, while its knockdown had opposite effects. Mechanistically, PPP1R12B could interact with p21-activated kinase 2 (PAK2) to suppress β-catenin expression and phosphorylation at Ser675, thereby impeding its nuclear translocation and subsequent transcriptional activation of Cyclin D1. This cascade culminated in G0/G1 phase cell cycle arrest. Furthermore, analysis of TCGA-HCC datasets confirmed inverse correlations between PPP1R12B and PAK2 or CTNNB1 (β-catenin) expression. Collectively, our findings elucidated a novel tumor-suppressive role of PPP1R12B in HCC through modulation of the PAK2/β-catenin/Cyclin D1 axis.

Keywords: PAK2/β-catenin axis; PPP1R12B; cell cycle; cell proliferation; hepatocellular carcinoma.


Conflict of interest statement

The authors declare that the research was conducted in the absence of any commercial or financial relationships that could be construed as a potential conflict of interest.

Figures

FIGURE 1
FIGURE 1
Clinical significance of PPP1R12B expression in HCC. (A) Comparative analysis of PPP1R12B transcript levels (log2 TPM) between HCC specimens (T, n = 100) and normal hepatic tissues (N, n = 97) from TCGA database (P = 1.6 × 10⁻³⁴). (B) Immunoblot analysis confirming reduced PPP1R12B protein levels in HCC specimens compared to paired adjacent non-tumor tissues (n = 29). (C) Immunoblot analysis demonstrating differential PPP1R12B protein expression in 29 paired HCC tumors and adjacent non-tumor tissues (P = 1.424 × 10⁻⁵). Protein quantification was normalized to β-actin loading controls. (D) Immunohistochemical staining illustrating representative PPP1R12B expression patterns in matched tumor and adjacent non-tumor tissue sections. The scale bar = 100 μm and 25 μm. (E) Tissue microarray (TMA) analysis depicting heterogeneous PPP1R12B immunoreactivity across HCC clinical samples. The scale bar = 300 μm and 100 μm. (F) Kaplan-Meier survival curves demonstrating significantly prolonged overall survival in HCC patients with high PPP1R12B expression (n = 228, log-rank trend test).
FIGURE 2
FIGURE 2
Prognostic significance of PPP1R12B in HCC patients. (A) Multivariate Cox regression analysis incorporating TNM staging identified tumor size (HR = 1.086, 95% CI 1.038–1.135, P = 0.000315) and vascular invasion (HR = 1.779, 95% CI 1.118–2.831, p = 0.015) as independent risk factors, while PPP1R12B expression (HR = 0.631, 95% CI 0.411–0.968, p = 0.035) demonstrated protective effects. (B) Alternative multivariate model excluding TNM staging confirmed PPP1R12B’s persistent protective role (HR = 0.601, 95% CI 0.393–0.918, p = 0.018), with tumor size (HR = 1.083, 95% CI 1.037–1.132, p = 0.000331), lymph node metastasis (HR = 4.455, 95% CI 1.603–12.378, p = 0.004), and distant metastasis (HR = 1.761, 95% CI 1.114–2.783, p = 0.015) emerging as additional risk factors. Both models were constructed using forward stepwise regression with AIC-based variable selection.
FIGURE 3
FIGURE 3
PPP1R12B inhibits HCC cell proliferation in vivo and in vitro. (A) Cell viability analysis demonstrating enhanced proliferation in PPP1R12B-knockdown HCC cells compared to controls (HHL5-P = 0.0077, PLC/PRF/5-P = 7.55 × 10⁻⁶, CSQT-2-P = 0.0001). (B) Clonogenic survival assays showing increased colony formation capacity following PPP1R12B depletion. Quantitative data represent mean colony counts from three independent experiments (±SEM) (HHL5-P = 0.0005, PLC/PRF/5-P = 0.0384, CSQT-2-P = 0.0018). (C) Cell viability analysis revealing significant proliferation inhibition in PPP1R12B-overexpressing HCC cells versus vector controls (Huh7-P = 1.28 × 10⁻⁵, HepG2-P = 0.0005, MHCC-97H-P = 0.0376). (D) Representative images and quantification of colony formation assays demonstrating reduced proliferative capacity in PPP1R12B-overexpressing cells (mean ± SEM) (Huh7-P = 1.04 × 10⁻⁷, HepG2-P = 0.0062, MHCC-97H-P = 3.17 × 10⁻⁶). (E) Comparative tumor weights from xenograft models at endpoint, showing significant reduction in PPP1R12B-overexpressing Huh7 cell-derived tumors versus controls (P = 0.0086). (F) Longitudinal tumor growth kinetics in nude mice implanted with PPP1R12B-modified Huh7 cells. Data points represent mean tumor volumes (±SEM) measured every 3 days (P = 0.0093).
FIGURE 4
FIGURE 4
PPP1R12B induces cell cycle arrest at the G0/G1 to S phase. (A) Flow cytometric analysis of cell cycle distribution in HHL5 cells following PPP1R12B knockdown, demonstrating a significant decrease in G0/G1 phase population (50.2% vs. 46.6% in controls, P = 0.0079) and concomitant increase in S phase cells (30.0% vs. 31.6%, P = 0.0454). (B) Flow cytometric analysis of cell cycle distribution in HHL5 cells and PLC/PRF/5 cells following PPP1R12B knockdown, demonstrating a significant decrease in G0/G1 phase population (69.4% vs. 63.1% in controls, P = 0.0003) and concomitant increase in S phase cells (17.8% vs. 23.7%, P = 0.0004). (C) Cell cycle profiling of MHCC-97H cells overexpressing PPP1R12B revealed G0/G1 phase arrest (43.3% vs. 46.2% in vector controls, P = 0.0005) with reduced S phase entry (35.2% vs. 32.9%, P = 0.0032). Data represent mean percentages (±SEM) from three independent experiments.
FIGURE 5
FIGURE 5
PAK2 plays a key role in PPP1R12B-mediated HCC proliferation suppression. (A) Schematic overview of the phosphoproteomic profiling strategy comparing PPP1R12B-overexpressing Huh7 cells with vector controls. The workflow includes protein extraction, tryptic digestion, phosphopeptide enrichment, LC-MS/MS analysis, and database search. (B) Protein interaction network of differentially phosphorylated proteins, with PPP1R12B positioned as a central node. The network was constructed using STRING with a confidence score threshold of 0.7. (C) Co-immunoprecipitation analysis demonstrating physical interaction between PPP1R12B and PAK2. Left: Flag-tagged PPP1R12B immunoprecipitated endogenous PAK2 in both Huh7 and HepG2 overexpression cells. Right: Reciprocal co-IP confirmed the interaction using PAK2 antibody for pulldown. (D) Immunofluorescence microscopy revealing subcellular co-localization of PPP1R12B (green) and PAK2 (red) in HCC cells. Nuclei were counterstained with DAPI (blue). Scale bars: 50 μm. (E) Functional rescue experiments showing that PAK2 knockdown (siPAK2) abrogated the proliferative effects of PPP1R12B modulation in CCK-8 assays.
FIGURE 6
FIGURE 6
PPP1R12B suppresses proliferation via the PAK2/β-catenin/Cyclin D1 axis. (A) Confocal microscopy analysis demonstrating reduced β-catenin expression (green) following PAK2 (red) knockdown in Huh7 and HepG2 cells. Nuclei were counterstained with DAPI (blue). Scale bars: 50 μm. (B) PAK2-knockdown reduced total β-catenin, p-β-catenin (Ser675), and the expression of Cyclin D1 in CSQT-2 and HHL5 cells. (C) PPP1R12B overexpression decreased while knockdown increased the expression of PAK2, β-catenin, p-β-catenin (Ser675) and Cyclin D1 in HepG2 overexpression cells and CSQT-2 knockdown cells. (D,E) TOPFlash reporter assays measuring β-catenin transcriptional activity: (D) PAK2 knockdown significantly reduced β-catenin-mediated transcription (Huh7-P = 0.0003, HepG2-P = 0.0005); (E) PPP1R12B modulation correspondingly altered β-catenin activity (HepG2-P = 0.0411, CSQT-2-P = 0.0002, HHL5-P = 0.0037). (F) Subcellular fractionation analysis demonstrating PPP1R12B knockdown increased nuclear β-catenin accumulation. GAPDH and Lamin B1 served as compartment-specific controls. (G) CCK-8 assay revealed that palbociclib inhibited HCC cell proliferation and counteracted the proliferative changes induced by PPP1R12B modulation in HepG2 overexpression cells and CSQT-2 knockdown cells. The data were presented as mean ± SEM.
FIGURE 7
FIGURE 7
Clinical correlation between PPP1R12B and PAK2/β-catenin in HCC patients. (A) Transcriptomic analysis of PAK2 expression across multiple HCC cohorts (GSE22058, GSE36376, GSE14520, OEP000321) demonstrating significant upregulation in tumor tissues versus adjacent non-tumor controls (GSE22058-P = 0.0070, GSE36376-P = 6.89 × 10⁻²⁶, GSE14520-P = 9.48 × 10−39, OEP000321-P = 4.38 × 10⁻¹⁸). Boxplots represent median values with interquartile ranges. Data presented as log2-transformed TPM values. (B) Comparative analysis of CTNNB1 (β-catenin) mRNA levels showing consistent overexpression in HCC specimens across above datasets (GSE22058-P = 1.14 × 10⁻⁸, GSE36376-P = 0.0406, GSE14520-P = 4.77 × 10⁻²⁵, OEP000321-P = 2.90 × 10⁻¹⁷). Boxplots represent median values with interquartile ranges. Data presented as log2-transformed TPM values. (C) Spearman correlation analysis of TCGA-LIHC data revealing significant inverse relationships: PPP1R12B vs. PAK2: r = −0.2417, P = 0.0308; PPP1R12B vs. CTNNB1: r = −0.2489, p = 0.0260.
FIGURE 8
FIGURE 8
Schematic model. PPP1R12B suppresses HCC cell proliferation through the PAK2/β-catenin/Cyclin D1 axis. PPP1R12B could interact with PAK2 to suppress the expression and Ser675 phosphorylation of β-catenin, thereby inhibiting its nuclear translocation and the expression of its downstream target gene CCND1, which regulated cell proliferation.

Similar articles

References

    1. Bertoli C., Skotheim J. M., de Bruin R. A. M. (2013). Control of cell cycle transcription during G1 and S phases. Nat. Rev. Mol. Cell Biol. 14, 518–528. 10.1038/nrm3629 - DOI - PMC - PubMed
    1. Bray F., Laversanne M., Sung H., Ferlay J., Siegel R. L., Soerjomataram I., et al. (2024). Global cancer statistics 2022: GLOBOCAN estimates of incidence and mortality worldwide for 36 cancers in 185 countries. CA Cancer J. Clin. 74, 229–263. 10.3322/caac.21834 - DOI - PubMed
    1. Chang A. N., Battiprolu P. K., Cowley P. M., Chen G., Gerard R. D., Pinto J. R., et al. (2015). Constitutive phosphorylation of cardiac myosin regulatory light chain in vivo . J. Biol. Chem. 290, 10703–10716. 10.1074/jbc.M115.642165 - DOI - PMC - PubMed
    1. Chen L., Zhang C., Xue R., Liu M., Bai J., Bao J., et al. (2024). Deep whole-genome analysis of 494 hepatocellular carcinomas. Nature 627, 586–593. 10.1038/s41586-024-07054-3 - DOI - PubMed
    1. Chen X.-P., Yang Z.-T., Yang S.-X., Li E.-M., Xie L. (2025). PAK2 as a therapeutic target in cancer: mechanisms, challenges, and future perspectives. Biochim. Biophys. Acta Rev. Cancer 1880, 189246. 10.1016/j.bbcan.2024.189246 - DOI - PubMed

LinkOut - more resources