

Animal studies on the modulation of differential efficacy of polyethylene glycol loxenatide by intestinal flora
- PMID: 40612440
- PMCID: PMC12221906
- DOI: 10.3389/fendo.2025.1508473
Animal studies on the modulation of differential efficacy of polyethylene glycol loxenatide by intestinal flora
Abstract
Background: Gut microbiota has demonstrated an increasingly important role in the onset and development of type 2 diabetes mellitus (T2DM), Further investigations have revealed the interactions between drugs and the gut microbiome. However, there are still gaps in research regarding the potential interactions between the gut microbiota and GLP-1 and their therapeutic response in people with T2DM. In addition, Fecal microbiota transplantation (FMT) has become a promising strategy for patients with T2DM.
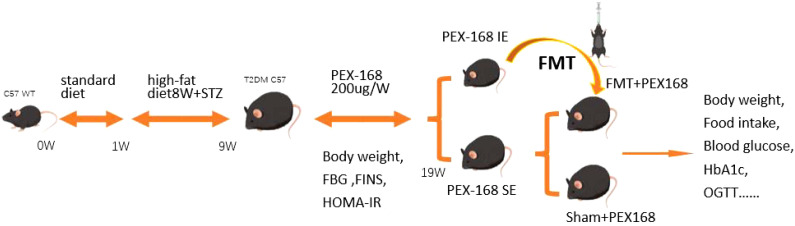
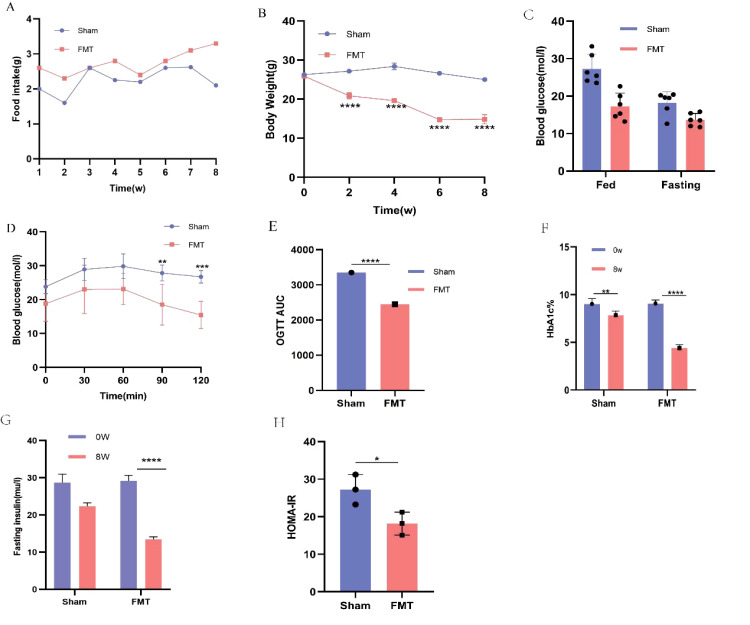
Design animals and measurements: 50 healthy male C57BL/6 mice were fed a high-fat diet in combination with STZ to establish a T2DM mouse model. 40 mice were divided into the T2DM group (n=10) and the PEX168 group (n=30). the PEX168 group was divided into two subgroups of the IE group (HbA1c ≤6. 5%, n=12) and the SE group (HbA1c >6. 5%, n=12), 12 mice in each group. Using IE mice as fecal donors and SE mice as recipients, fecal microbiota transplantation was performed between the two groups, the FMT group (given fecal bacterial suspension, n=5) and the Sham group (given equal amounts of sterile saline, n=5). The intestinal microorganisms of mice in the IE group (donor) and SE group (recipient) were also analyzed for differences. To assess the protective effect of FMT on drug efficacy and T2DM, and to explore the underlying mechanisms.
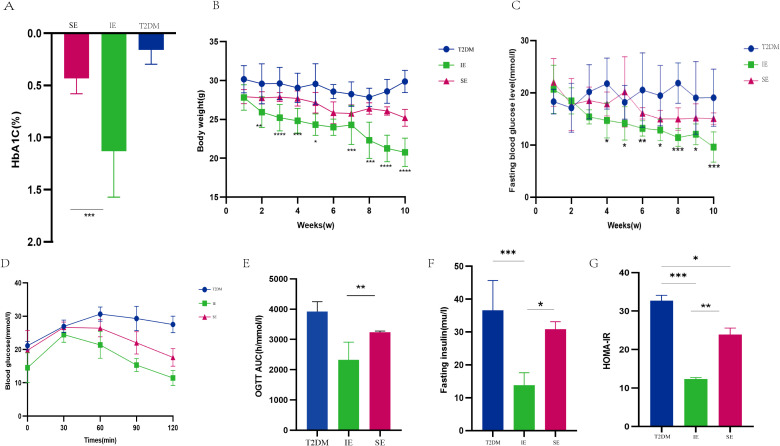
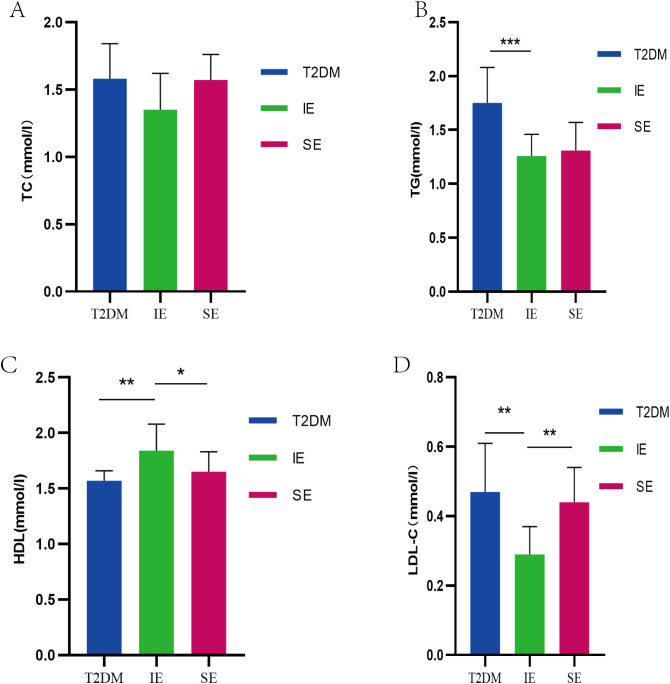
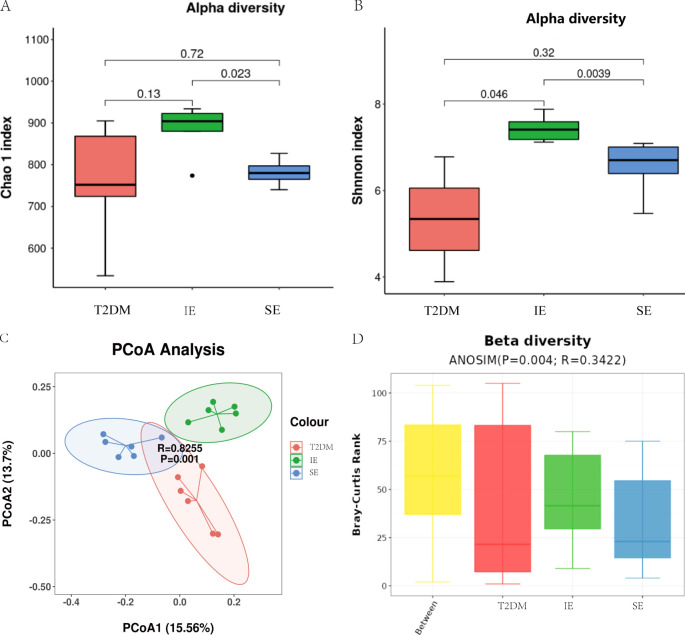
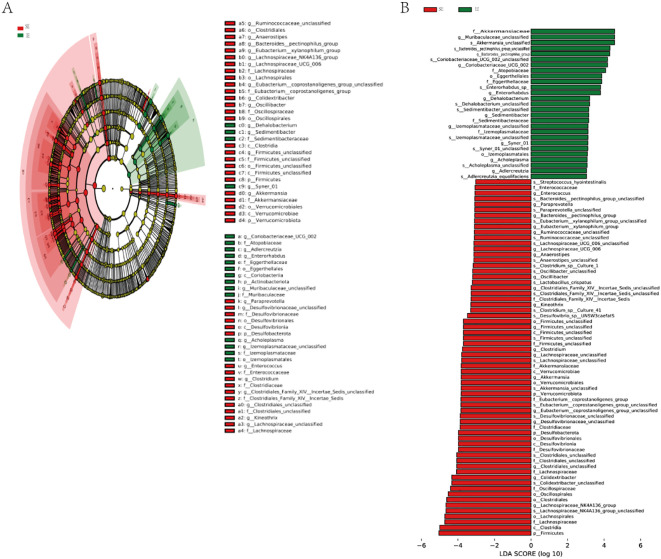
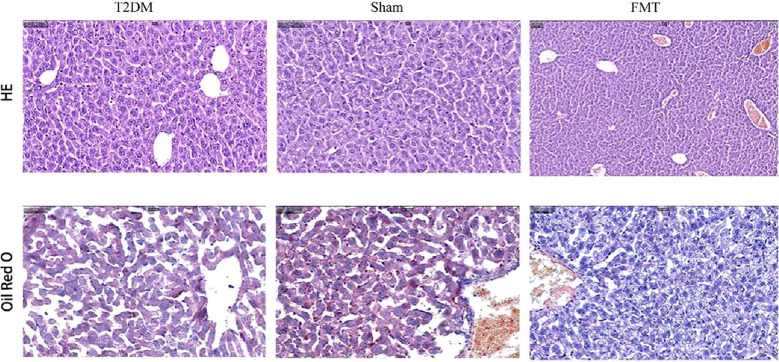
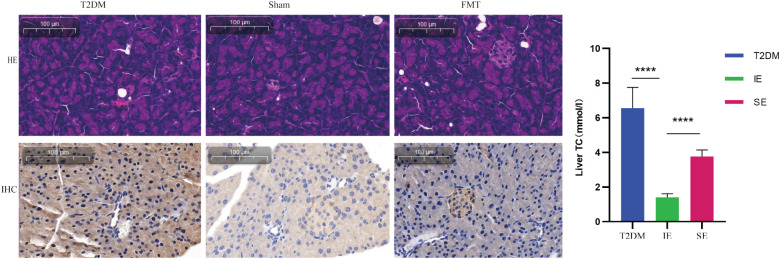
Results: After 10 weeks, compared with the control group, the HbA1c of the experimental group was significantly reduced, still, the level of HBA1c of the mice in the unsatisfactory group was significantly higher than that in the ideal group. Compared with the unsatisfactory group, fasting blood glucose, 2h postprandial blood glucose, blood glucose AUC and body weight were significantly reduced in the ideal group. 16srDNA sequencing showed that the levels of Bacteroidota, Akkermansia, Parabacteroides, Bifidobacteria and other bacteria in the ideal efficacy group were significantly higher than those in the non-ideal efficacy group (P<0.05). The levels of Firmicutes, Romboutsia, Clostridium, Turicibacter and other bacteria in the unsatisfactory group were significantly higher than those in the ideal group (P<0.05). The dominant flora of mice in the ideal drug efficacy group was negatively correlated with HbA1c and blood sugar, and the dominant flora of mice in the unsatisfactory drug efficacy group was positively correlated with pro-inflammatory factors such as blood sugar. Moreover, FMT treatment significantly improved the efficacy of PEX168 and liver steatosis in the group with unsatisfactory efficacy.
Conclusion: In summary, we used the combined method of 16S rDNA and metabolomics to systematically elucidate the efficacy of microflora on PEX168 and the possible mechanism of FMT in treating T2DM by PEX168. The difference in intestinal flora between individuals can affect the therapeutic effect of drugs. Moreover, FMT therapy can affect multiple metabolic pathways and colonization of beneficial bacteria to maintain the drug's therapeutic effect on T2DM mice.
Keywords: 16S rDNA; GLP-1 receptor agonists; fecal microbiota transplantation; intestinal flora; polyethylene glycol exenatide; type 2 diabetes.
Copyright © 2025 Wenjiao, Yurou, Jiaqi, Yan, Hongfang, Min and Jianjin.
Conflict of interest statement
The authors declare that the research was conducted in the absence of any commercial or financial relationships that could be construed as a potential conflict of interest.
Figures

Similar articles
-
Aerobic exercise alleviates cognitive impairment in T2DM mice through gut microbiota.Sci Rep. 2025 Jul 4;15(1):23917. doi: 10.1038/s41598-025-07220-1. Sci Rep. 2025. PMID: 40615512 Free PMC article.
-
Fecal microbiota transplantation for the treatment of recurrent Clostridioides difficile (Clostridium difficile).Cochrane Database Syst Rev. 2023 Apr 25;4(4):CD013871. doi: 10.1002/14651858.CD013871.pub2. Cochrane Database Syst Rev. 2023. PMID: 37096495 Free PMC article.
-
Intestinal inflammation and microbiota modulation impact cochlear function: emerging insights in gut-ear axis.Cell Commun Signal. 2025 Jul 26;23(1):357. doi: 10.1186/s12964-025-02338-1. Cell Commun Signal. 2025. PMID: 40713718 Free PMC article.
-
Dipeptidyl-peptidase (DPP)-4 inhibitors and glucagon-like peptide (GLP)-1 analogues for prevention or delay of type 2 diabetes mellitus and its associated complications in people at increased risk for the development of type 2 diabetes mellitus.Cochrane Database Syst Rev. 2017 May 10;5(5):CD012204. doi: 10.1002/14651858.CD012204.pub2. Cochrane Database Syst Rev. 2017. PMID: 28489279 Free PMC article.
-
Fecal Microbiota Transplantation Alleviates Airway Inflammation in Asthmatic Rats by Increasing the Level of Short-Chain Fatty Acids in the Intestine.Inflammation. 2025 Jun;48(3):1538-1552. doi: 10.1007/s10753-024-02233-w. Epub 2025 Jan 7. Inflammation. 2025. PMID: 39775370 Free PMC article.
References
MeSH terms
Substances
LinkOut - more resources
Full Text Sources
Medical