

Association between three-timepoint maternal blood pressure trajectories during pregnancy and low birth weight: a longitudinal study based on NHANES 2005-2006
- PMID: 40612487
- PMCID: PMC12222151
- DOI: 10.3389/fped.2025.1604845
Association between three-timepoint maternal blood pressure trajectories during pregnancy and low birth weight: a longitudinal study based on NHANES 2005-2006
Abstract
Background: Dynamic changes in maternal blood pressure influence neonatal birth weight however, studies investigating the association between blood pressure trajectories during pregnancy and low birth weight (LBW) remain limited. This study aims to identify maternal blood pressure trajectories based on three time points using group-based trajectory modeling (GBTM) and explore their association with LBW.
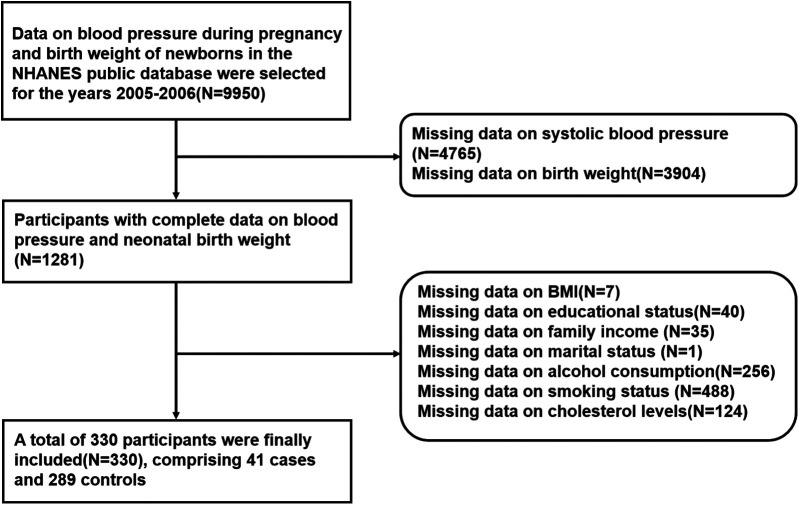
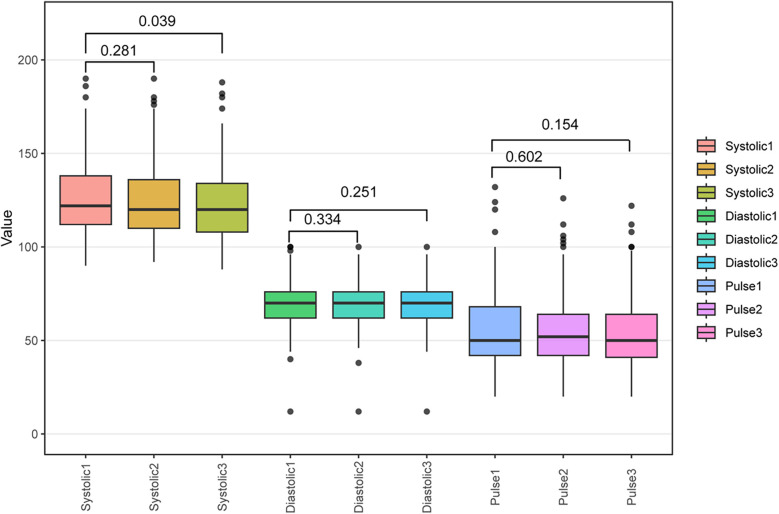
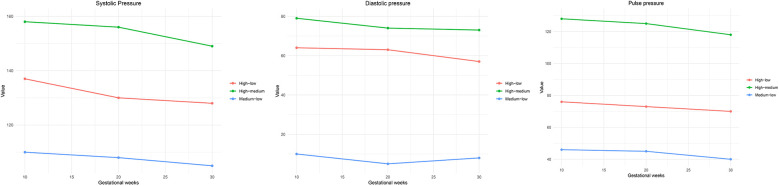
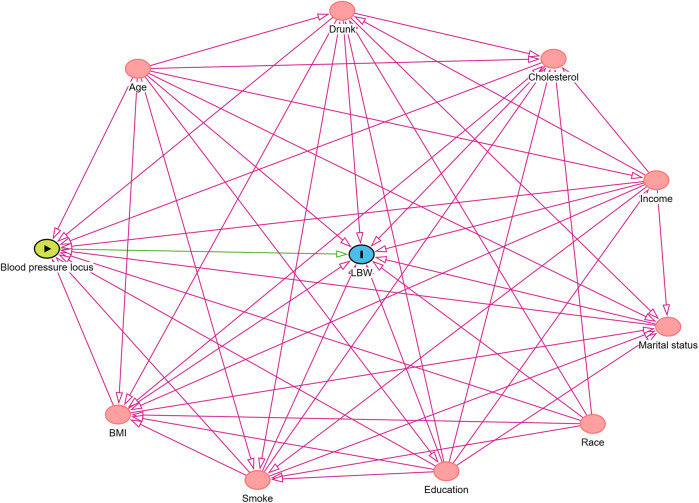
Methods: This study was based on the NHANES 2005-2006 database and included 330 pregnant women meeting the eligibility criteria (41 cases in the LBW group and 289 in the control group). GBTM was applied to model three blood pressure measurements [systolic blood pressure (SBP), diastolic blood pressure (DBP), pulse pressure (PP)] taken during pregnancy. Multilevel logistic regression was used to assess the relationship between blood pressure trajectories and LBW. Additionally, stratified analyses were conducted to evaluate the modifying effects of age, body mass index (BMI), and education level, and directed acyclic graph (DAG) were employed for covariate selection.
Results: Three distinct blood pressure trajectory patterns were identified. Logistic regression revealed that, compared with the low blood pressure trajectory, mothers with a high-medium SBP trajectory had a significantly increased risk of delivering an LBW infant [odds ratio [OR] = 4.479, 95% confidence interval [CI]: 2.541-7.895, P < 0.001]. Stratified analyses indicated that this association was more pronounced in mothers who were older than 40 years, had a BMI >28, had lower income, did not consume alcohol, and had abnormal cholesterol levels. The DAG analysis further supported the independent effect of blood pressure trajectories on LBW.
Conclusions: Maternal blood pressure trajectories based on three prenatal measurements are closely associated with LBW, particularly among mothers with a high-medium SBP trajectory. This study underscores the importance of monitoring blood pressure fluctuations during pregnancy and suggests that early intervention may help reduce the risk of LBW.
Keywords: directed acyclic graph (DAG); group-based trajectory modeling (GBTM); low birth weight (LBW); maternal risk factors; pregnancy blood pressure trajectories; systolic blood pressure (SBP).
© 2025 Liu, Wei, Zhang, Meng, Ding and Liu.
Conflict of interest statement
The authors declare that the research was conducted in the absence of any commercial or financial relationships that could be construed as a potential conflict of interest.
Figures
Similar articles
-
Metformin for women who are overweight or obese during pregnancy for improving maternal and infant outcomes.Cochrane Database Syst Rev. 2018 Jul 24;7(7):CD010564. doi: 10.1002/14651858.CD010564.pub2. Cochrane Database Syst Rev. 2018. PMID: 30039871 Free PMC article.
-
Multiple-micronutrient supplementation for women during pregnancy.Cochrane Database Syst Rev. 2017 Apr 13;4(4):CD004905. doi: 10.1002/14651858.CD004905.pub5. Cochrane Database Syst Rev. 2017. Update in: Cochrane Database Syst Rev. 2019 Mar 14;3:CD004905. doi: 10.1002/14651858.CD004905.pub6. PMID: 28407219 Free PMC article. Updated.
-
Gestational weight gain below instead of within the guidelines per class of maternal obesity: a systematic review and meta-analysis of obstetrical and neonatal outcomes.Am J Obstet Gynecol MFM. 2022 Sep;4(5):100682. doi: 10.1016/j.ajogmf.2022.100682. Epub 2022 Jun 18. Am J Obstet Gynecol MFM. 2022. PMID: 35728780
-
Antiretrovirals for reducing the risk of mother-to-child transmission of HIV infection.Cochrane Database Syst Rev. 2011 Jul 6;(7):CD003510. doi: 10.1002/14651858.CD003510.pub3. Cochrane Database Syst Rev. 2011. PMID: 21735394
-
Antiretrovirals for reducing the risk of mother-to-child transmission of HIV infection.Cochrane Database Syst Rev. 2007 Jan 24;(1):CD003510. doi: 10.1002/14651858.CD003510.pub2. Cochrane Database Syst Rev. 2007. Update in: Cochrane Database Syst Rev. 2011 Jul 06;(7):CD003510. doi: 10.1002/14651858.CD003510.pub3. PMID: 17253490 Updated.
References
-
- Alonso-lopez P, Arroyas M, Beato M, Ruiz-gonzalez S, Olabarrieta I, Garcia-Garcia ML. Respiratory, cardio-metabolic and neurodevelopmental long-term outcomes of moderate to late preterm birth: not just a near term-population. A follow-up study. Front Med (Lausanne). (2024) 11:1381118. 10.3389/fmed.2024.1381118 - DOI - PMC - PubMed
-
- Milazzo R, Garbin M, Consonni D, Casati D, Faiola S, Laoreti A, et al. Maternal hemodynamic evaluation in monochorionic twin pregnancy complicated by twin-to-twin transfusion syndrome treated with fetoscopic laser surgery. Am J Obstet Gynecol MFM. (2024) 6:101270. 10.1016/j.ajogmf.2023.101270 - DOI - PubMed
LinkOut - more resources
Full Text Sources
Miscellaneous