. 2025 Jul 2;15(7):e71694.
doi: 10.1002/ece3.71694. eCollection 2025 Jul.

Rapid Shifts in Relative Abundance Obscure Temporal Diversity Changes in a Metacommunity

Affiliations

Rapid Shifts in Relative Abundance Obscure Temporal Diversity Changes in a Metacommunity

William Godsoe et al. Ecol Evol. .

Abstract

Changes in biodiversity reflect processes acting at multiple spatial scales, from local to global, among habitats and within communities. This complexity makes it difficult to measure mechanisms that have traditionally interested ecologists, such as environmental filters. To resolve this, we propose an approach to partition temporal changes in biodiversity into contributions from selection at multiple scales. We applied this approach to study changes in the biodiversity of invertebrate herbivores from a large-scale, plant community experiment. Though the experiment was designed to foster distinct insect communities due to differences in host plants, our approach showed that selection among these treatments was a negligible facet of diversity change. These effects were swamped by rapid changes in relative abundances of aphids due to both immigration and selection across the metacommunity. More broadly, our work highlights how total change in biodiversity across a biogeographic region can be partitioned into logically distinct mechanisms.

Keywords: Hill numbers; beta diversity; community assembly; mesocosm; metacommunity; scale.


Conflict of interest statement

The authors declare no conflicts of interest.

Figures

FIGURE 1
FIGURE 1
Changes in biodiversity can result from selection at different scales. Each panel shows a biogeographic region consisting of four communities divided into two habitats, with Communities 1 and 2 dominated by deciduous plants and Communities 3 and 4 dominated by coniferous plants. Species 1, a moth (purple) is restricted to Community 1 and Species 2, is a broadly distributed aphid (blue). Each panel shows changes between two observations. (A) Illustrates species‐scale selection, where Species 2 increases in relative abundance across all communities (highlighted in gray). (B) Illustrates habitat‐scale selection, where the blue species increases in the deciduous dominated habitat 1 relative to the coniferous dominated Habitat 2. (C) Illustrates community‐scale selection, where Species 2 increases in some communities relative to others. At present, it is not clear how to disentangle the effects of selection at each scale.
FIGURE 2
FIGURE 2
Effects of selection on biodiversity can be obscured by other, less intuitive mechanisms. (A) Shows a plot of biodiversity versus relative abundance for a two species community as a function of the relative abundance of one species (green line). Changes in relative abundance in the same direction sometimes leads to radically different effects. For example, weak selection in favor of a rare species (a) may increase biodiversity, but stronger selection in favor of the same rare species can decrease biodiversity (b). These unintuitive consequences are captured by the transmission term in (Equation 3). (B) Immigration can also change biodiversity. In this panel, the arrival of a new species (black) decreases the evenness of the community, leading to a decline in Shannon entropy from H = 0.69 in observation 1 to H = 0.63 in observation 2.
FIGURE 3
FIGURE 3
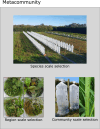
In a biogeographic region, biodiversity change can reflect processes acting at multiple scales. Species‐scale selection occurs when a species increases in relative abundance across the entire biogeographic region; in our case, a series of experimental plant communities with mesh cages used to enclose invertebrate herbivore communities. Habitat‐scale selection occurs when a species increases in abundance in some environments relative to others; in our case, individual mesh enclosures were planted with one of 20 different combinations of host plant species (with plant communities acting as “habitats”; four shown here as an example). Community‐scale selection occurs when a species increases in abundance in some communities relative to others; in our case, a few individual enclosures where an individual insect species increased in abundance (mostly Rhopalosiphum padi aphids, shown here on the exotic host grass Holcus lanatus ).
FIGURE 4
FIGURE 4
Summary of shifts in relative abundances of species across the biogeographic region. The impact of these shifts on biodiversity are captured by the species‐level selection term. (A) shows the relative abundance of immigrants by period (black line), with the relative abundances of irruptive species highlighted, including Rhopalosiphum padi (green), Anzygina zealandica (orange), and Myzus persicae (blue). Immigrants of species other than these three are colored in gray. (B) Shows relative abundances among residents, with the black line denoting the proportion of resident species (1—the proportion of immigrants).
FIGURE 5
FIGURE 5
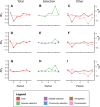
Biodiversity declined during the initial phase and then rebounded gradually for gamma (A), alpha (D), and beta (G) diversity. In general, species‐scale selection (green) explained the rebounds in biodiversity (gamma, B; alpha, E; beta, H), although it had the strongest effect on gamma diversity. Note the horizontal bars denote 95% bootstrapped confidence intervals. Species‐scale selection was partially obscured by transmission (pink; gamma, C; alpha, F; beta, I). Immigration (brown) explained the decline of biodiversity at period 2 (gamma, C; alpha, F; beta, I). Habitat‐scale selection (purple) had negligible effects (alpha, E, beta, H). Community‐scale selection (blue) also had negligible effects (alpha, E, beta, H). Since gamma diversity treats all individuals of a given species equally regardless of their location, it is insensitive to the other two selection terms. The y‐axis is presented in units of change in Shannon entropy H (axis on left hand side of plot). Some researchers find it more intuitive to present analyses of biodiversity using eH the equivalent number of uniformly distributed species (i.e., Hill numbers); for this reason, we present this scale on the right‐hand side.

References

    1. Abrams, P. A. , and Wilson W. G.. 2004. “Coexistence of Competitors in Metacommunities due to Spatial Variation in Resource Growth Rates; Does R* Predict the Outcome of Competition?” Ecology Letters 7: 929–940.
    1. Agrawal, A. A. , Kotanen M. C., Mitchell E. A., Power G., Godsoe W., and Klironomos J.. 2005. “Enemy Release? An Experiment With Congeneric Plants Pairs and Diverse Above‐ and Belowground Enemies.” Ecology 86: 2979–2989.
    1. Allen, W. J. P. , Waller L. P., Barratt B. I., Dickie I. A., and Tylianakis J. M.. 2021. “Exotic Plants Accumulate and Share Herbivores Yet Dominate Communities via Rapid Growth.” Nature Communications 12: 1–12. - PMC - PubMed
    1. Barner, A. K. , Coblentz K. E., Hacker S. D., and Menge B. A.. 2018. “Fundamental Contradictions Among Observational and Experimental Estimates of Non‐Trophic Species Interactions.” Ecology 99: 557–566. - PubMed
    1. Berkley, H. A. , Kendall B. E., Mitarai S., and Siegel D. A.. 2010. “Turbulent Dispersal Promotes Species Coexistence.” Ecology Letters 13: 360–371. - PMC - PubMed

LinkOut - more resources