. 2025 Jun 20;21(9):4131-4152.
doi: 10.7150/ijbs.111228. eCollection 2025.

Acute Exposure to Cadmium Triggers NCOA4-Mediated Ferritinophagy and Ferroptosis in Never-Smokers Oral Cancer Cells

Affiliations

Acute Exposure to Cadmium Triggers NCOA4-Mediated Ferritinophagy and Ferroptosis in Never-Smokers Oral Cancer Cells

Lavinia Petriaggi et al. Int J Biol Sci. .

Abstract

Cadmium (Cd), a carcinogenic component of tobacco, is a recognized risk factor for oral squamous cell carcinoma (OSCC). However, the molecular mechanisms underlying Cd-induced cytotoxicity in OSCC remain largely undefined. Here, we demonstrate that acute Cd exposure triggers ferroptosis in CAL27 OSCC cells derived from never-smokers, but not in SCC154 cells derived from smokers. Mechanistically, Cd outcompetes Fe, causing early iron depletion and activating the nuclear receptor coactivator 4 (NCOA4)-mediated ferritinophagy. This process enhances the labile iron pool, promotes mitochondrial reactive oxygen species (ROS) generation, lipid peroxidation, and ferroptotic cell death. Notably, iron supplementation rescues CAL27 cells from Cd-induced damage, while exacerbating iron deficiency through transferrin receptor CD71 silencing amplifies cytotoxicity. Conversely, OSCC cells from smokers exhibit resistance to Cd toxicity, likely due to the overexpression of metallothionein 2A (MT2A), a heavy metal detoxification protein. Collectively, this study provides the evidence that ferritinophagy may act as a critical upstream driver of Cd-induced ferroptosis in OSCC cells derived from never-smokers, paving the way for potential ferroptosis-targeted therapeutic strategies in Cd-associated malignancies.

Keywords: Cadmium; Ferritinophagy; Ferroptosis; Iron Metabolism; NCOA4; Oral Cancer; Smokers.


Conflict of interest statement

Competing Interests: The authors have declared that no competing interest exists.

Figures
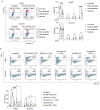
Figure 1
Figure 1
Citotoxicity induced by CdCl2 is reversed by the ferroptosis and autophagy inhibitors, Fer-1 and Baf, only in CAL27 cells. (A) Representative plots of Annexin V/7-AAD apoptosis assay (left) and relative histograms (right) of CAL27 and SCC154 cells upon treatment with 26.01μM CdCl2 (12h). (B) PI flow cytometry assay and relative histograms of CAL27 and SCC154 cells treated with CdCl2 (26.01μM for 12h) alone or in combination with Fer-1 (100μM for 24h) and Baf (1μM for 12h). % of dead cells (PI positive) are reported in each dot plot. All data represent the mean of three independent experiments. Histograms are reported as mean ± SD. p-value: *≤0.05; ****≤0.0001. ns: not significant.
Figure 2
Figure 2
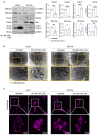
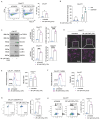
CdCl2 administration induces NCOA4-mediated ferritinophagy in CAL27 cells. (A) Western blot analysis and relative optical densitometry of NCOA4, FtH1, LC3B (I-II) and mTORC1 and p-mTORC1 in CAL27 and SCC154 cells treated with 26.01μM CdCl2 (12h). GAPDH was used as normalization control for protein quantification. (B) Representative images of morphological and ultrastructural features detected by TEM in CAL27 and SCC154 upon treatment with CdCl2 (26.01μM for 12h). Yellow arrows, autophagosome. (C) Fluorescence microscopy analysis of LIP content with FerroOrange dye in CAL27 and SCC154 cells after treatment with 26.01μM CdCl2 (12h). All the experiments were carried out in triplicate. Histograms are reported as mean ± SD. p-value: **≤0.01; ***≤0.001; ****≤0.0001. ns: not significant.
Figure 3
Figure 3
CdCl2 treatment triggers mitochondrial dysfunction only in CAL27 cells. Flow cytometry analyses and relative histograms of mitochondrial ROS levels (A) and mitochondrial membrane potential (B) assessed by MitoSOX and TMRM reagents, respectively, in CAL27 and SCC154 cells following treatment with 26.01μM CdCl2 (12h). (C) Representative images of morphological and ultrastructural features detected by TEM in CAL27 and SCC154 upon treatment with CdCl2 (26.01μM for 12h). Pink arrows: damaged mitochondria. Each experiment was performed in triplicate. Histograms are presented as mean ± SD. p-value: ***≤0.001; ****≤0.0001. ns: not significant.
Figure 4
Figure 4
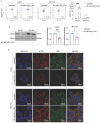
CAL27 cells shows lipid peroxidation after CdCl2 administration. (A) Flow cytometry analysis and relative histograms of lipid peroxidation quantified by using BODIPY-C11 in CAL27 and SCC154 cells upon treatment with 26.01μM CdCl2 (12h). (B) Western blot analysis and relative optical densitometry of GPX4 in CAL27 and SCC154 cells treated with 26.01μM CdCl2 (12h). GAPDH was used as normalization control for protein quantification. (C) Fluorescence microscopy analysis of GSH content in CAL27 and SCC154 cells after treatment with 26.01μM CdCl2 (12h). ACTIN and DAPI dyes were used to detect microfilament and nuclei, respectively. Scale bar: 20 μM. All data represent the mean of three independent experiments. Histograms are reported as mean ± SD. p-value: *≤0.05; ***≤0.001; ****≤0.0001.
Figure 5
Figure 5
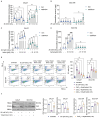
CdCl2 citotoxicity is associated with the ability of cadmium to compete with iron. (A-B). Quantification of iron and cadmium intracellular amount through ICP-MS in CAL27 and SCC154 cells treated with 26.01μM CdCl2 at 30', 1h, 6h, and 12h. (C-D). ICP-MS analysis of iron and cadmium intracellular amount in CAL27 and SCC154 cells upon treatment with 26.01μM CdCl2 (12h) alone or in combination with ferlixit (25, 50 and 100μM for 12h). (E) PI flow cytometry assay and relative histograms of CAL27 and SCC154 cells treated with CdCl2 (26.01μM for 12h) alone or in combination with ferlixit (25, 50 and 100 μM for 12h). % of dead cells (PI positive) are reported in each dot plot. (F) Western blot analysis and relative optical densitometry of NCOA4 and FtH1 in CAL27 and SCC154 cells treated with 26.01μM CdCl2 (12h) alone or in combination with 100μM ferlixit (12h). GAPDH was used as normalization control for protein quantification. All data represent the mean of three independent experiments. Histograms are reported as mean ± SD. p-value: *≤0.05; **≤0.01; ***≤0.001; ****≤0.0001. ns: not significant.
Figure 6
Figure 6
Proteomic analysis of OSCC cells treated with CdCl2. (A) Heatmap of DEPs (TOP 20 up and TOP 20 down) in CAL27 cells treated with 26.01μM CdCl2 (12h) vs untreated. Color intensity is proportional to the magnitude of changes. Relative expression levels are shown in red (upregulation) and green (downregulation). (B) Heatmap of DEPs in SCC154 cells treated with 26.01μM CdCl2 (12h) vs untreated. Color intensity is proportional to the magnitude of changes. Relative expression levels are shown in red (upregulation) and green (downregulation). (C) GO analysis of of DEPs in CAL27 cells treated with 26.01μM CdCl2 (12h) vs untreated. The dot size denotes the number of DEPs, while colors correspond to the adjusted p-value range. (D) p-ƔH2AX flow cytometry analysis and relative histograms CAL27 and SCC154 cells treated with CdCl2 (26.01μM for 12h). % of positive (+) cells are reported in each dot plot. Each experiment was performed in triplicate. Histograms are presented as mean ± SD. p-value: ****≤0.0001. ns: not significant.
Figure 7
Figure 7
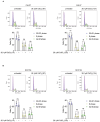
CdCl2 exposure induces G2-M phase arrest in CAL27 cells derived from never smokers. Cell cycle analysis via flow cytometry and relative histograms of CAL27 (A) and SCC154 (B) cells treated with 26.01μM CdCl2 for 1h and 12h. Each experiment was performed in triplicate. Histograms are presented as mean ± SD. p-value: *≤0.05; **≤0.01. ns: not significant.
Figure 8
Figure 8
Effects of CdCl2 exposure in CAL27T cells. To obtain CAL27T (CAL27 Tolerant to Cd) CAL27 were exposed to low doses of CdCl2 (10μM) for 30 days. (A) PI flow cytometry assay and relative histograms of CAL27T cells treated with CdCl2 (26.01μM for 12h). % of dead cells (PI positive) are reported in each dot plot. (B) Quantification of iron and cadmium intracellular amount through ICP-MS in CAL27T cells treated with 26.01μM CdCl2 (12h). (C) Western blot analysis and relative optical densitometry of NCOA4, FtH1, LC3B (I-II), mTORC1 and p-mTORC1 in CAL27T cells treated with 26.01μM CdCl2 (12h). GAPDH was used as normalization control for protein quantification. (D) Fluorescence microscopy analysis of LIP content with FerroOrange dye in CAL27T cells after treatment with 26.01μM CdCl2 (12h). Flow cytometry analyses and relative histograms of mitochondrial ROS amount (E), mitochondrial membrane potential (F) and lipid peroxidation (G) assessed by using MitoSOX, TMRM and BODIPY-C11 reagents, respectively, in CAL27T cells following treatment with 26.01μM CdCl2 (12h). Each experiment was performed in triplicate. Histograms are presented as mean ± SD. p-value: *≤0.05; ***≤0.001; ****≤0.0001. ns: not significant.

References

    1. You Y, Guo Z, Wolter T, Hu Q. Intracellular metal ion-based chemistry for programmed cell death. Chem Soc Rev. 2025 Feb 3;54(3):1552–1582. - PubMed
    1. Lai Y, Gao F fen, Ge R ting, Liu R, Ma S, Liu X. Metal ions overloading and cell death. Cell Biol Toxicol. 2024;40(1):1–17. Available from: https://link.springer.com/article/10.1007/s10565-024-09910-4. - PMC - PubMed
    1. Gu J, Guo C, Ruan J, Li K, Zhou Y, Gong X. et al. From ferroptosis to cuproptosis, and calcicoptosis, to find more novel metals-mediated distinct form of regulated cell death. Apoptosis. 2024;29(5-6):586–604. Available from: https://pubmed.ncbi.nlm.nih.gov/38324163/ - PubMed
    1. Li Y, Du Y, Zhou Y, Chen Q, Luo Z, Ren Y. et al. Iron and copper: critical executioners of ferroptosis, cuproptosis and other forms of cell death. Cell Communication and Signaling 2023 21:1. 2023;21(1):1–19. Available from: https://biosignaling.biomedcentral.com/articles/10.1186/s12964-023-01267-1. - PMC - PubMed
    1. Dagdag O, Quadri TW, Haldhar R, Kim SC, Daoudi W, Berdimurodov E. et al. An Overview of Heavy Metal Pollution and Control. ACS Symposium Series. 2023;1456:3–24. Available from: https://pubs.acs.org/doi/full/10.1021/bk-2023-1456.ch001.

MeSH terms