. 2025 Jun 20;21(9):4252-4269.
doi: 10.7150/ijbs.112672. eCollection 2025.

Coupling of glucose metabolism with mitophagy via O-GlcNAcylation of PINK1

Affiliations

Coupling of glucose metabolism with mitophagy via O-GlcNAcylation of PINK1

Zhiwei Xu et al. Int J Biol Sci. .

Abstract

Mitophagy is a selective form of autophagy for the clearance of damaged and dysfunctional mitochondria via the autophagy-lysosome pathway. As mitochondria are the most important metabolic organelles, the process of mitophagy is tightly regulated by glucose metabolism. At present, it is known that glucose is required for the mitophagy process, while the underlying mechanisms remain to be further elucidated. In this study, we establish a novel regulatory role of glucose metabolism in mitophagy via protein O-GlcNAcylation. First, we found that acute mitochondrial damage enhanced glucose uptake and promoted protein O-GlcNAcylation. Second, we provided evidence that protein O-GlcNAcylation promotes PINK1-Parkin-dependent mitophagy. Next, we attempted to illustrate the molecular mechanisms underlying the regulation of O-GlcNAcylation in mitophagy by focusing on PTEN-induced kinase 1 (PINK1). One important observation is that PINK1 is O-GlcNAcylated upon acute mitochondrial damage, and suppression of O-GlcNAcylation impairs PINK1 protein stability and its phosphorylated ubiquitin, leading to impaired mitophagy. More importantly, we found that glucose metabolism promotes mitophagy via regulating O-GlcNAcylation. Taken together, this study demonstrates a novel regulatory mechanism connecting glucose metabolism with mitophagy via O-GlcNAcylation of PINK1. Therefore, targeting the O-GlcNAcylation may provide new strategies for the modulation of mitophagy and mitophagy-related human diseases.

Keywords: HBP; O-GlcNAcylation; PINK1; glucose metabolism; mitophagy.


Conflict of interest statement

Competing Interests: The authors have declared that no competing interest exists.

Figures
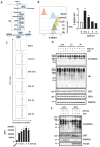
Figure 1
Figure 1
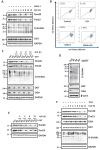
Increased glucose uptake and protein O-GlcNAcylation in YFP-HeLa cells. (A) Flow cytometry assay of glucose uptake by YFP-HeLa cells in the 2-NBDG assay. (B) with statistical data showing signals in the left panel. MFI, mean fluorescence intensity. (C) Flow cytometric analysis of intracellular O-GlcNAc levels in YFP-HeLa treated with O/A (1μM and 1μM) for 0.5 to 4 h. (D) YFP-Parkin expressing HeLa cells were pretreated with or without MG132 (10 μM) for 1 h. Subsequently, the cells were treated with or without O/A (1μM and 1μM) for 0.5, 1, 2 h and subjected to western blotting analysis with the indicated antibodies. (E) YFP-HeLa cells were pretreated with or without MG132 (10 μM) for 1 h, then treated with or without 1 μM O/A for 1 h. Subcellular fractionation was then performed to isolate the cytosolic and mitochondrial fractions. Tim23 and GAPDH were used as mitochondrial and cytosolic markers, respectively. *p < 0.05.
Figure 2
Figure 2
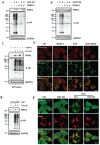
Disruption of O-GlcNAcylation inhibits O/A-induced mitophagy. (A) YFP-HeLa cells were pretreated with OSMI-1 (50 μM) for 12 h, then treated with 1 μM O/A and harvested at the indicated time points for western blotting analysis with the indicated antibodies. (B) Cells were pretreated with or without OSMI-1 for 24 h, and treated with 1 μM O/A for 4 h, then analyzed by FACS for lysosomal positive mt-mKeima. (C) YFP-HeLa cells or OGT knockdown cells were treated with 1 μM O/A for the indicated time, were then lysed for western blotting analysis. (D) Mcherry-Parkin expressing control HeLa cells or OGT knockout cells were lysed for western blotting analysis to confirm the knockout effects of OGT. (E) Mitochondria content was determined by immunoblotting of proteins from OMM and IMM compartments in control and OGT KO cells. (F) YFP-HeLa cells were overexpressed with or without OGA, and were treated with 1 μM O/A and harvested at the indicated time points for immunoblotting. (G) Mcherry-Parkin expressing HeLa or GFAT1-KO cells were treated with 1 μM O/A and harvested at the indicated time points for western blotting analysis.
Figure 3
Figure 3
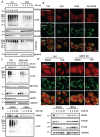
O-GlcNAcylation promotes PINK1 level and its phosphorylated ubiquitin. (A and B) HEK293T cells were pretreated with OSMI-1 (50 μM) for 24h, then were treated with 1 μM O/A or 20 μM CCCP and harvested at the indicated time points for western blotting analysis with the indicated antibodies. (C) YFP-HeLa cells were pretreated with OSMI-1 (50 μM) for 24 h, then were treated with 1 μM O/A and harvested at the indicated time points for western blotting analysis. (D)Representative images of mCherry-Parkin, GFP-mitochondrial expressing HeLa cells pretreated with OSMI-1 for 24h and treated with O/A for 2 h. (E) YFP-HeLa or OGT KD cells were treated with 1 μM O/A and harvested at 2 h for western blotting analysis. (F) Representative images of YFP-HeLa and OGT KD cells treated with O/A for 2h as indicated by YFP-Parkin and mitochondrial marker HSP60. Scale bar=10μm.
Figure 4
Figure 4
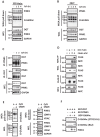
Mitophagy is impaired when HBP enzyme is inhibited. (A) YFP-HeLa cells were pretreated with DON (100 μM) for 12 h, then treated with 1 μM O/A and harvested at the indicated time points for western blotting analysis with the indicated antibodies. (B) Representative images of mCherry-Parkin, GFP-mitochondrial expressing HeLa cells pretreated with DON (100 μM) for 24h and treated with O/A for 2 h. Scale bar=10μm. (C) PINK1, P-Ub, and mitochondrial membrane proteins were determined by immunoblotting in control and GFAT1-KO cells upon O/A induction. (D) mcherry-Parkin, GFP-mitochondrial expressing HeLa cells treated with 1 μM O/A for 2 h compared with GFAT1-KO cells, and representative images were taken. Scale bar=10μm. (E) YFP-HeLa cells were pretreated with FR054 (1mM) for 12 h, then treated with 1 μM O/A and harvested at the indicated time points for western blotting analysis with the indicated antibodies.
Figure 5
Figure 5
PINK1 protein is O-GlcNAcylated and interacts with OGT. (A and B) YFP-HeLa or HEK293T cells were treated with 1 μM O/A for the indicated time points. WGA was used to affinity pull-down O-GlcNAcylated proteins, and then immunoblot to detect PINK1 using an anti-PINK1 antibody. (C) YFP-Parkin expressing HeLa cells were treated with or without 1μM O/A for 1 and 2 hours. Subsequently, the cells were harvested for immunoprecipitation with anti-PINK1 or OGT antibody and analyzed by western blotting. (D) HEK293T cells were transfected with OGT-FLAG and/or PINK1-MYC as indicated for 48 h and were lysed with IP lysis buffer. The cell lysates were subjected to MYC IP or FLAG IP and analyzed by western blotting. (E) HEK293T cells were pretreated with OSMI-1 for 24 h and treated with 1 μM O/A for 2h. WGA was used to pull down O-GlcNAcylated proteins, and then immunoblot to detect using the indicated antibody. (F) PINK1 is O-GlcNAcylated in vitro. GST-PINK1 was incubated overnight with GST-tagged OGT and 5 mM UDP-GlcNAc, then immunoblotted with the antibodies.
Figure 6
Figure 6
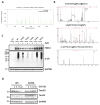
PINK1 Serine 229 mediated PINK1-parkin-mediated mitophagy. (A) Graphics of PINK1 O-GlcNAcylation using computational methods based on the development of PTM-specific databases (https://services.healthtech.dtu.dk/services/YinOYang-1.2/). (B) Site mapping of the PINK1 O-GlcNAcylation modification site in peptides KMMWNISAGSSSEAI, LNTMSQELVPASRV, LVDYPDVLPSRLHPEGLGHGRTLFL with LC-MS/MS analysis. (C) PINK1 WT, S225A, S229A, T236A, and S301A mutants were expressed in HeLa PINK1-/- stably expressing mCherry-Parkin cells following O/A treatment for 2 hours, subjected to western blot with PINK1 and phospho-ubiquitin. (D) PINK1 WT and S229A were transfected in HeLa PINK1-/- stably expressing mCherry-Parkin cells, the time course for mitochondrial proteins detection upon treatment with O/A. Scale bar=10μm.
Figure 7
Figure 7
Glucose regulates mitophagy via protein O-GlcNAcylation. (A) The control and OGT KO HeLa stably expressing mCherry-Parkin were treated with glucose-containing or glucose-free DMEM for eight hours, and the starved cells were further incubated with glucose for 8 h. Then the cells were stimulated with O/A for 2 h before collecting. PINK1, p-Ub and O-GlcNAcylation expression levels under the above treatment display a significant response to glucose starvation. (B) Similar treatments were examined in GFAT1 KO cells upon O/A-induced mitophagy. (C) Parkin mitochondrial translocation and GFP-mitochondrial were monitored by confocal microscopy in control and OGT KO HeLa cells stably expressing mCherry-Parkin and GFP-mitochondrial. Scale bar=10μm. (D) Schematic model for the positive regulatory role of O-GlcNAcylation in mitophagy. Glucose is fluxed through the HBP via a series of metabolic enzymes, including GFAT, GNPNAT1, PGM3 and UAP1, producing UDP-GlcNAc for O-GlcNAcylation. O-GlcNAcylation is a crucial positive modulator of mitophagy that promotes PINK1 stability and its activation to mediate PINK1/Parkin-dependent mitophagy. Importantly, glucose metabolism is an important regulator of mitophagy, mainly via O-GlcNAcylation in response to mitochondrial damage. The schematic model is created with BioRender.com.
Figure 7
Figure 7
Glucose regulates mitophagy via protein O-GlcNAcylation. (A) The control and OGT KO HeLa stably expressing mCherry-Parkin were treated with glucose-containing or glucose-free DMEM for eight hours, and the starved cells were further incubated with glucose for 8 h. Then the cells were stimulated with O/A for 2 h before collecting. PINK1, p-Ub and O-GlcNAcylation expression levels under the above treatment display a significant response to glucose starvation. (B) Similar treatments were examined in GFAT1 KO cells upon O/A-induced mitophagy. (C) Parkin mitochondrial translocation and GFP-mitochondrial were monitored by confocal microscopy in control and OGT KO HeLa cells stably expressing mCherry-Parkin and GFP-mitochondrial. Scale bar=10μm. (D) Schematic model for the positive regulatory role of O-GlcNAcylation in mitophagy. Glucose is fluxed through the HBP via a series of metabolic enzymes, including GFAT, GNPNAT1, PGM3 and UAP1, producing UDP-GlcNAc for O-GlcNAcylation. O-GlcNAcylation is a crucial positive modulator of mitophagy that promotes PINK1 stability and its activation to mediate PINK1/Parkin-dependent mitophagy. Importantly, glucose metabolism is an important regulator of mitophagy, mainly via O-GlcNAcylation in response to mitochondrial damage. The schematic model is created with BioRender.com.

References

    1. Wang L, Klionsky DJ, Shen HM. The emerging mechanisms and functions of microautophagy. Nat Rev Mol Cell Biol. 2023;24:186–203. - PubMed
    1. Yamamoto H, Zhang S, Mizushima N. Autophagy genes in biology and disease. Nat Rev Genet. 2023;24:382–400. - PMC - PubMed
    1. Uoselis L, Nguyen TN, Lazarou M. Mitochondrial degradation: Mitophagy and beyond. Mol Cell. 2023;83:3404–20. - PubMed
    1. Pickles S, Vigie P, Youle RJ. Mitophagy and Quality Control Mechanisms in Mitochondrial Maintenance. Curr Biol. 2018;28:R170–R85. - PMC - PubMed
    1. Picca A, Faitg J, Auwerx J, Ferrucci L, D'Amico D. Mitophagy in human health, ageing and disease. Nat Metab. 2023;5:2047–61. - PMC - PubMed