. 2025 Jun 2;36(3):102580.
doi: 10.1016/j.omtn.2025.102580. eCollection 2025 Sep 9.

ACE-2 blockade and TMPRSS2 inhibition mitigate SARS-CoV-2 severity following cigarette smoke exposure in airway epithelial cells in vitro

Affiliations

ACE-2 blockade and TMPRSS2 inhibition mitigate SARS-CoV-2 severity following cigarette smoke exposure in airway epithelial cells in vitro

Shah S Hussain et al. Mol Ther Nucleic Acids. .

Abstract

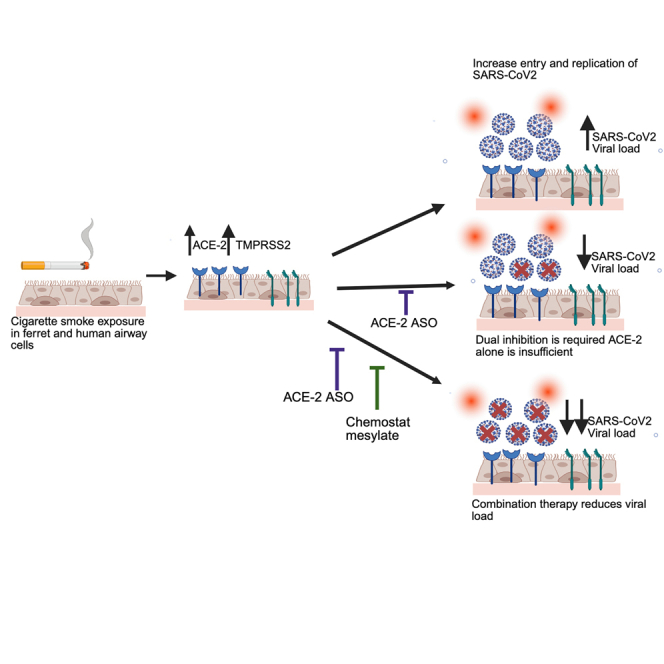
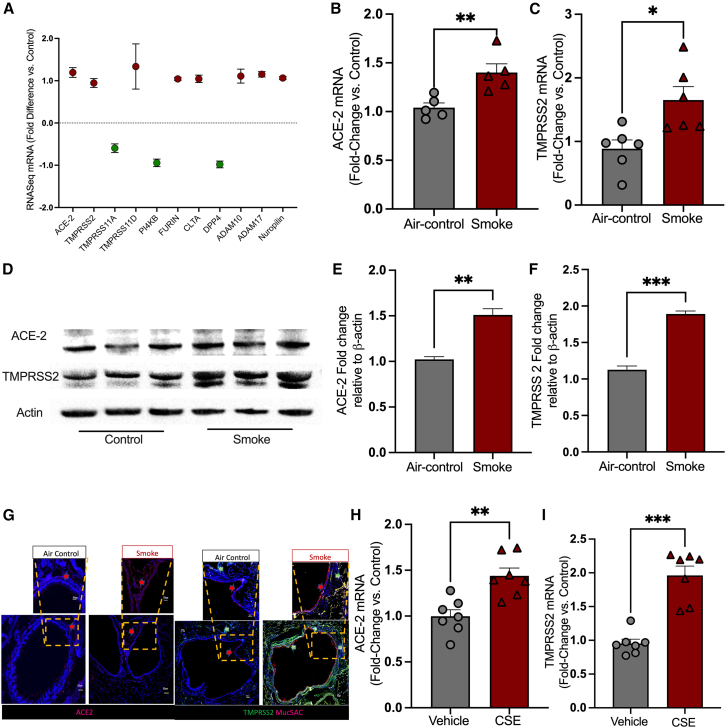
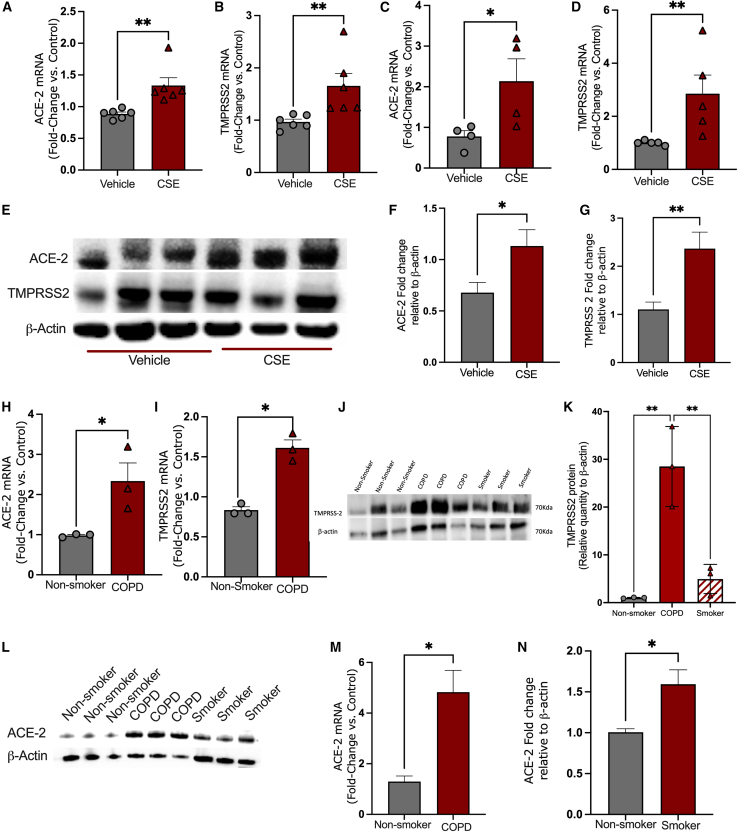
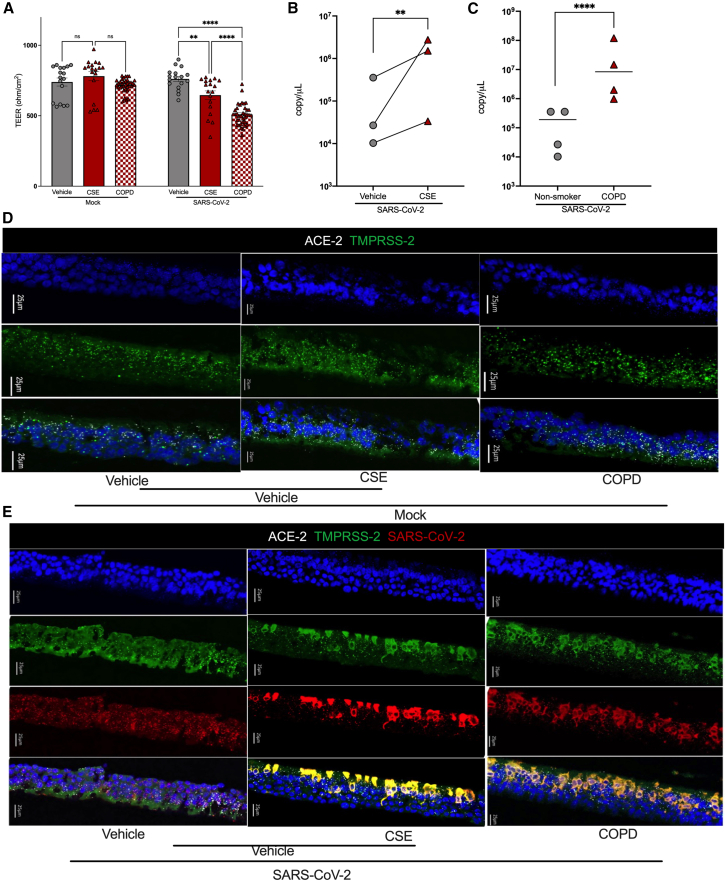
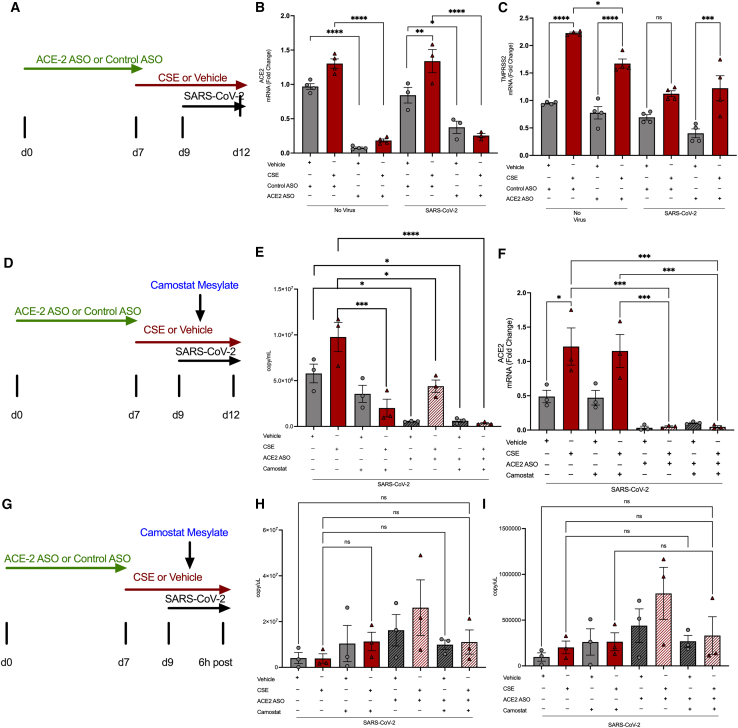
Cigarette smoking is associated with COVID-19 prevalence and severity, but the mechanistic basis for how smoking alters SARS-CoV-2 pathogenesis is unknown. A potential explanation is that smoking alters the expression of the SARS-CoV-2 cellular receptor and point of entry, angiotensin-converting enzyme 2 (ACE-2), and its cofactors including transmembrane protease serine 2 (TMPRSS2). We investigated the impact of cigarette smoking on the expression of ACE-2, TMPRSS2, and other known cofactors of SARS-CoV-2 infection and the resultant effects on infection severity in vitro. Cigarette smoke extract (CSE) exposure increased ACE-2 and TMPRSS2 mRNA expression compared to air control in ferret airway cells, Calu-3 cells, and primary human bronchial epithelial (HBE) cells derived from normal and chronic obstructive pulmonary disease (COPD) donors. CSE-exposed ferret airway cells inoculated with SARS-CoV-2 had a significantly higher intracellular viral load versus vehicle-exposed cells. Likewise, CSE exposure increased both SARS-CoV-2 intracellular viral load and viral replication in both normal and COPD HBE cells over vehicle control. Apoptosis was increased in CSE-exposed, SARS-CoV-2-infected HBE cells. Knockdown of ACE-2 via an antisense oligonucleotide (ASO) reduced SARS-CoV-2 viral load and infection in CSE-exposed ferret airway cells that was augmented by co-administration of camostat mesylate to block TMPRSS2 activity. Smoking increases SARS-CoV-2 infection via upregulation of ACE2 and TMPRSS2.

Keywords: ACE-2; ASO; CSE; MT: Oligonucleotides: Therapies and Applications; SARS-Cov2; TMPRSS2; airway epithelial cells.


Conflict of interest statement

The authors declare no competing financial interests.

Figures

None
Graphical abstract
Figure 1
Figure 1
ACE-2 and TMPRSS2 expression are elevated in cigarette-smoke-exposed ferret lung (A) Dot plot shown from RNA-seq analysis of SARS-CoV-2 receptor and associated gene expression in lung tissue of ferrets exposed to cigarette smoke for 6 months. (B) ACE-2 and (C) TMPRSS2 mRNA expression in lung tissue from smoke-exposed vs. air control ferrets as assessed by real-time qPCR. (D) Representative western blot and (E) quantification of ACE-2 expression in smoke-exposed ferret lung. (F) Quantification of TMPRSS2 expression in smoke-exposed ferret lung. (G) Representative immunofluorescence images of smoke-exposed and air-control ferret lung sections stained with ACE-2 antibody (red) and DAPI (blue). Scale bars, 50 μM. Areas of magnification (magnification 40X) are outlined by the red dashed line. (H) Representative immunofluorescence images of smoke-exposed and air-control ferret lung sections stained with TMPRSS-2 antibody (Green), Muc5AC (red), and DAPI (blue). Scale bars, 50 μM. Areas of magnification (magnification 40X) are outlined by the red dashed line. Real-time qPCR analysis of (I) ACE2 and (J) TMPRSS2 mRNA expression in terminally differentiated ferret tracheal epithelial cells (FTECs) exposed to cigarette smoke extract (CSE) or vehicle control. ∗p < 0.05, ∗∗p < 0.005,∗∗∗p < 0.0005.
Figure 2
Figure 2
ACE-2 and TMPRSS2 expression are elevated in CSE-exposed human airway cells Real-time qPCR measurement of (A) ACE-2 and (B) TMPRSS2 mRNA expression in Calu-3 cells exposed to cigarette smoke extract (CSE) or vehicle control for 48 h Real-time qPCR measurement of (C) ACE-2 and (D) TMPRSS2 mRNA expression in primary human bronchial epithelial (HBE) cells derived from healthy control donors and treated with CSE or vehicle control for 48 h. N = 3 monolayers/condition across 3–4 different donors. Western blot image HBE cells treated with cigarette smoke extract for 24 h (E) and quantitation of western blot for ACE2 (F) and TMPRSS2 (G). Real-time qPCR measurement of (H) ACE-2 and (I) TMPRSS2 mRNA expression in bronchial epithelial cells derived from patients with COPD (COPD HBE) or healthy non-smoker donors. N = 3 monolayers/condition across 3–4 different donors. Western blot analysis of lung tissue from COPD and healthy non-smoker donors (J), with corresponding quantification of TMPRSS2 protein expression (K). (G) Representative western blot for ACE2 (L), with quantification of ACE2 protein expression comparing non-smokers vs. COPD (M) and non-smokers vs. smokers (N). N = 3–4 monolayers/conditions derived from 3 to 4 different donors. ∗p < 0.05, ∗∗p < 0.005.
Figure 3
Figure 3
SARS-CoV-2 infection is increased in CSE-exposed FTECs and Calu-3 cells (A) Schematic outline for experiments evaluating the relationship between cigarette smoking and SARS-CoV-2 infection in ferret tracheal epithelial cells (FTECs) and Calu-3 cells. Cells were treated with cigarette smoke extract (CSE) or vehicle control for 48 h prior to inoculation with SARS-CoV-2 (MOI-3). After 72 h of SARS-CoV-2 infection with concomitant CSE exposure, cells were harvested for analysis. (B) Quantification of viral load by real-time qPCR of SARS-CoV-2 mRNA at 3 days post-infection in FTECs exposed to CSE or vehicle control, with (C) visualization and (D) quantification of SARS-CoV-2-infected cells by foci forming assay in Vero-E6 cells. N = 3–5 well per conditions. (E) Quantification of viral load by real-time qPCR at 3 days after SARS-CoV-2 infection in Calu-3 cells exposed to CSE or vehicle control, with (F) visualization and (G) quantification of SARS-CoV-2-infected cells by foci forming assay in Vero-E6 cells. N = 3–5 well per conditions. ∗p < 0.05, ∗∗p < 0.01.
Figure 4
Figure 4
SARS-CoV-2 genomic replication is increased in CSE-exposed normal HBE cells and HBE cells derived from COPD patients (A) Transepithelial electrical resistance (TEER) measurements in vehicle-treated, cigarette smoke extract (CSE)-treated, and COPD human bronchial epithelial (HBE) monolayer cultures infected with SARS-CoV-2 or mock infection. The data were obtained by averaging three independent Transwell reads, each of which represented the mean of three separate readings. (N = 3–5) HBE. Each line corresponds to a distinct donor (3–5 donors in total), and each donor is represented by 3–5 replicates. (B) Quantification of viral load by real-time qPCR of SARS-CoV-2 mRNA at 72 h post-infection with SARS-CoV-2 in CSE- or vehicle-exposed HBE cells. N = 3 different donors, with each line representing a separate donor. (C) Quantification of viral load by real-time qPCR of SARS-CoV-2 mRNA at 72 h post-infection with SARS-CoV-2 in healthy non-smoker or COPD HBE cells. N = monolayers/condition derived from 3 to 5 different donors. (D and E) Representative images using RNAscope in situ hybridization for comparable detection of genomic RNA with only the SARS-CoV-2-specific S probe. Images show CSE- or vehicle-exposed HBE cells, and healthy non-smoker or COPD HBE cells, at 72 h post-inoculation with (D) mock infection or (E) SARS-CoV-2. SARS-CoV-2 (red), TMPRSS2 (green), ACE-2 (white), nuclei (blue). ∗∗p < 0.01.
Figure 5
Figure 5
Simultaneous ACE2 blockade and TMPRSS2 inhibition reduces SARS-CoV-2 infection after CSE exposure in FTECs (A) Scheme depicting the approach to ACE2 antisense oligonucleotide (ASO) treatment, cigarette smoke extract (CSE) exposure, and SARS-CoV-2 infection in ferret tracheal epithelial cells (FTECs). Seven days of treatment with ACE2 ASO (20 μM) or control ASO was followed by a 48-h incubation period in CSE or vehicle control prior to inoculation with SARS-CoV-2 or no virus for 72 h of infection. Assessment of mRNA expression of (B) ACE-2 and (C) TMPRSS2 following the scheme depicted in (A). (D) Scheme depicting the approach to ACE2 ASO and camostat mesylate treatment, CSE exposure, and SARS-CoV-2 infection in FTECs. Camostat mesylate (100 mM) was added for 2 h on day 9, prior to inoculation with SARS-CoV-2. Assessment of (E) viral load and mRNA expression of (F) ACE-2 and (G) SARS-Cov2 infection for a shorter duration following the scheme depicted in (D). Viral load following shorter duration of infection (H) and (I). Real-time qPCR was used for mRNA quantification in all studies. ∗p < 0.05, ∗∗p < 0.01, ∗∗∗p < 0.001, ∗∗∗∗p < 0.0001.

Update of

Similar articles

References

    1. Hoffmann M., Kleine-Weber H., Schroeder S., Krüger N., Herrler T., Erichsen S., Schiergens T.S., Herrler G., Wu N.H., Nitsche A., et al. SARS-CoV-2 Cell Entry Depends on ACE2 and TMPRSS2 and Is Blocked by a Clinically Proven Protease Inhibitor. Cell. 2020;181:271–280.e8. doi: 10.1016/j.cell.2020.02.052. - DOI - PMC - PubMed
    1. Lan J., Ge J., Yu J., Shan S., Zhou H., Fan S., Zhang Q., Shi X., Wang Q., Zhang L., Wang X. Structure of the SARS-CoV-2 spike receptor-binding domain bound to the ACE2 receptor. Nature. 2020;581:215–220. doi: 10.1038/s41586-020-2180-5. - DOI - PubMed
    1. Hoffmann M., Kleine-Weber H., Schroeder S., Krüger N., Herrler T., Erichsen S., Schiergens T.S., Herrler G., Wu N.-H., Nitsche A., et al. SARS-CoV-2 Cell Entry Depends on ACE2 and TMPRSS2 and Is Blocked by a Clinically Proven Protease Inhibitor. Cell. 2020;181:271–280.e8. doi: 10.1016/j.cell.2020.02.052. - DOI - PMC - PubMed
    1. Imai Y., Kuba K., Rao S., Huan Y., Guo F., Guan B., Yang P., Sarao R., Wada T., Leong-Poi H., et al. Angiotensin-converting enzyme 2 protects from severe acute lung failure. Nature. 2005;436:112–116. doi: 10.1038/nature03712. - DOI - PMC - PubMed
    1. Bourgonje A.R., Abdulle A.E., Timens W., Hillebrands J.L., Navis G.J., Gordijn S.J., Bolling M.C., Dijkstra G., Voors A.A., Osterhaus A.D., et al. Angiotensin-converting enzyme 2 (ACE2), SARS-CoV-2 and the pathophysiology of coronavirus disease 2019 (COVID-19) J. Pathol. 2020;251:228–248. doi: 10.1002/path.5471. - DOI - PMC - PubMed

LinkOut - more resources