. 2025 Jun 26;33(7):1649-1666.
doi: 10.32604/or.2025.056176. eCollection 2025.

Developing a prognostic signature and characterizing the tumor microenvironment based on centrosome-related genes in lung adenocarcinoma

Affiliations

Developing a prognostic signature and characterizing the tumor microenvironment based on centrosome-related genes in lung adenocarcinoma

Lingjie Xu et al. Oncol Res. .

Abstract

Background: The centrosome, a crucial cellular structure involved in the mitotic process of eukaryotic cells, plays a significant role in tumor progression by regulating the growth and differentiation of neoplastic cells. This makes the centrosome a promising target for therapeutic strategies in cancer treatment.

Methods: Utilizing data from the TCGA database, we identified centrosome-related genes and constructed a prognostic model for 518 lung adenocarcinoma patients. Prognosis-associated genes were initially screened using univariate Cox regression, with overfitting minimized by applying LASSO regression to remove collinearity. Finally, a set of 12 genes was selected through multivariable Cox regression for inclusion in the prognostic model.

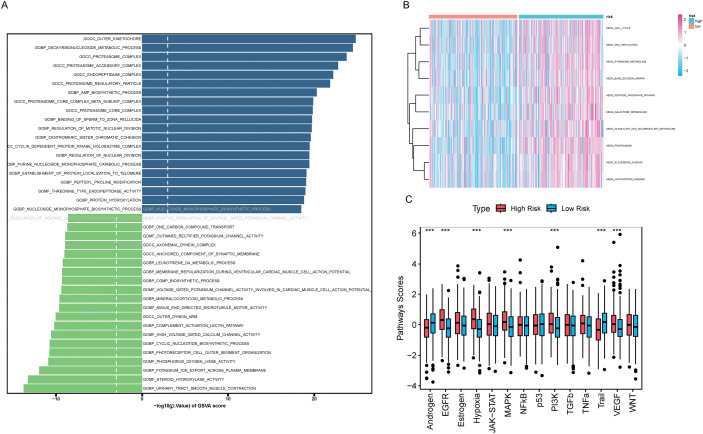
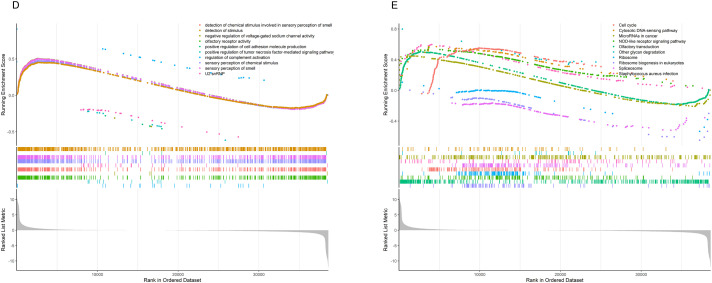
Results: The model's performance was assessed using ROC curve analysis, demonstrating a robust predictive ability with an AUC of 0.728 in the training group and 0.695 in the validation group. Differential expression analysis between high-risk (HRLAs) and low-risk (LRLAs) individuals was performed, followed by enrichment analyses using KEGG, GO, Progeny, GSVA, and GSEA. These analyses revealed significant differences in immune-related pathways between the two groups. Immune microenvironment assessment through ssGSEA and ESTIMATE indicated that individuals with poor prognosis exhibited lower immune, stromal, and ESTIMATE scores, along with higher tumor purity, suggesting an impaired immune microenvironment in HRLAs patients. Drug susceptibility analysis and molecular docking showed that HRLAs individuals were more responsive to docetaxel, emphasizing the therapeutic relevance of paclitaxel in this cohort.

Conclusion: We successfully developed and validated a centrosome-associated gene-based prognostic model, offering clinicians valuable insights for improved decision-making and personalized treatment strategies. This model may facilitate the identification of high-risk patients and guide therapeutic interventions in lung adenocarcinoma.

Keywords: Centrosome; Lung adenocarcinoma; Neoplastic microenvironment; Personalized treatment; Prognostic model.


Conflict of interest statement

The authors declare no conflicts of interest to report regarding the present study.

Figures

Figure 1
Figure 1. Overview of the analysis workflow.
Figure 2
Figure 2. Differences between adjacent normal tissue and lung adenocarcinoma tissue. (A) Venn diagram illustrates the intersection between centrosome-related genes and the entire transcriptome. (B) The heatmap illustrates gene expression and differential patterns between the two sample groups. (C) The volcano plot displays upregulated and downregulated genes along with their respective fold changes. (D) The PCA (Principal Component Analysis) plot demonstrates significant separation between the two sample groups. (E) The bubble plot illustrates the results of GO enrichment analysis for differentially expressed genes. (F) The bubble plot illustrates the results of KEGG enrichment analysis for differentially expressed genes.
Figure 3
Figure 3. Establishment of a prognostic model based on centrosome-related genes (A) LASSO coefficients for the four genes related to sphingolipid metabolism. (B) Gene discovery to conduct a predictive risk score model. (C) The forest plot illustrates the HR values and p-values of the model genes. (D) The survival analysis results for all patients. (E) The survival analysis results for patients in the training set. (F) The survival analysis results for patients in the validation set. (G) The distribution and risk score ranking of all patients. (H) The distribution and risk score ranking of patients in the training set. (I) The distribution and risk score ranking of patients in the validation set. “*” for p < 0.05, “**” for p < 0.01, and “***” for p < 0.001.
Figure 4
Figure 4. The independent prognostic analysis and model performance evaluation. (A) The forest plot displays the results of the univariate Cox analysis for the influencing factors in the training set. (B) The forest plot displays the results of the multivariate Cox analysis for the influencing factors in the training set. (C) The forest plot displays the results of the univariate Cox analysis for the influencing factors in the validation set. (D) The forest plot illustrates the results of the multivariate Cox analysis for the influencing factors in the validation set. (E) The 5-year ROC curves and corresponding AUC values based on various factors in the training set are presented in the graph. (F) The time-dependent ROC curves and corresponding area under the curve (AUC) values based on the training set are shown in the graph. (G) The 5-year ROC curves and corresponding AUC values based on various factors in the validation set are presented in the graph. (H) The time-dependent ROC curves and corresponding area under the curve (AUC) values based on the validation set are shown in the graph.
Figure 5
Figure 5. A nomogram was constructed to predict patient prognosis. (A) A nomogram was constructed based on sex, age, tumor stage, and risk score to predict patient prognosis. (B) Calibration curve is used to assess the accuracy and consistency of the prediction results from the nomogram. “**” for p < 0.01, and “***” for p < 0.001.
Figure 6
Figure 6. Tumor mutation landscape. (A) The waterfall plot shows the top 20 genes with the highest mutation rates in lung adenocarcinoma along with the nature of their mutations. (B) The waterfall plot illustrates the mutation landscape and the nature of mutations in the model genes in lung adenocarcinoma. (C) The mutation profile across different tumors is generally consistent with the analysis, with LUAD exhibiting a significantly higher tumor mutation burden. (D) LUAD patients with higher risk exhibit a higher tumor mutation burden. “*” for p < 0.05.
Figure 7
Figure 7. The differences in gene expression and functionality between the HRLAs and LRLAs. (A) The heatmap displays the expression of differentially expressed genes between the two groups. (B) The forest plot displays the upregulation and downregulation of differentially expressed genes and their fold changes. (C) The bar plot presents the results of differentially expressed genes in GO enrichment analysis. (D) The bubble plot displays the results of differentially expressed genes in KEGG enrichment analysis.
Figure 8
Figure 8. Results of GSVA and GSEA Analyses (A) The bidirectional bar chart presents the differences in GO pathway scores within the samples between the two groups. (B) The heatmap presents the differences in KEGG pathway scores within the samples between the two groups. (C) The differences in the scores of 14 classic tumor pathways between the two groups. (D) The results of Gene Set Enrichment Analysis (GSEA) in the Gene Ontology (GO) standard gene sets. (E) The results of Gene Set Enrichment Analysis (GSEA) in the KEGG standard gene sets. “***” for p < 0.001.
Figure 9
Figure 9. Characterization of the immune microenvironment (A) ESTIMATE score is lower in the HRLAs group. (B) Immune score is lower in the HRLAs group. (C) Stromal score is lower in the HRLAs group. (D) Tumor purity is higher in the HRLAs group. (E) Riskscore is significantly negatively correlated with ESTIMATE score. (F) Riskscore is significantly negatively correlated with immune score. (G) Riskscore is significantly negatively correlated with stromal score. (H) Riskscore is significantly positively correlated with tumor purity. (I) Epic immunoinfiltration analysis displayed the percentage content and differences of various types of cells. (J) QuanTIseq immune infiltration analysis showed the percentage content and differences of various types of cells. “*” for p < 0.05, “**” for p < 0.01, and “***” for p < 0.001.
Figure 10
Figure 10. Drug sensitivity and immune therapy response (A–H) The presentation includes 8 potential effective drugs and compares the differences in their IC50 values between the two groups. (I) The samples’ TIDE score ranking, indicating their response to immunotherapy. (J) The proportion of patients in the HRLAs and LRLAs who respond to immunotherapy. (K) The difference in TIDE scores between the two groups. “*” for p < 0.05, “**” for p < 0.01, and “***” for p < 0.001.
Figure 11
Figure 11. Immunohistochemistry (A) Expression of CDC25C in Normal Lung Tissue and Lung Adenocarcinoma Tissue. (B) Expression of DLGAP5 in Normal Lung Tissue and Lung Adenocarcinoma Tissue. (C) Expression of MZT2A in Normal Lung Tissue and Lung Adenocarcinoma Tissue. (D) Expression of PRC1 in Normal Lung Tissue and Lung Adenocarcinoma Tissue. (E) Expression of TRIM6 in Normal Lung Tissue and Lung Adenocarcinoma Tissue. (F) Expression of TROAP in Normal Lung Tissue and Lung Adenocarcinoma Tissue.
Figure 12
Figure 12. Knocking down PRC1 significantly inhibits the viability and proliferation of A549 cells (A) The qRT-PCR results show that si-RNA successfully reduced the mRNA levels of PRC1 (n = 3). (B) Western blot results show that si-RNA treatment reduced the protein levels of PRC1 in the cells (n = 3). (C) The CCK-8 results show that knocking down PRC1 significantly inhibits the viability of A549 cells (n = 3). (D) The results from the plate cloning assay show that after knocking down PRC1, there is a reduction in cell colony formation, indicating a decrease in cell proliferation ability (n = 3). “***” for p < 0.001, “****” for p < 0.0001 and “ns” for no statistical difference.
Figure 13
Figure 13. Knocking down PRC1 inhibits the migration and invasion abilities of A549 cells (A) The scratch assay results show that knocking down PRC1 weakens the migration ability of A549 cells (n = 3). (B) Statistical analysis of the healed area at 24 h (n = 3). (C) Statistical analysis of the healed area at 48 h (n = 3). (D) Statistical results of cell counting in Transwell experiments (n = 3). (E) The results of the Transwell experiment show that knocking down PRC1 significantly reduces the number of cells invading through the small chambers (n = 3). “****” for p < 0.0001 and “ns” for no statistical difference.

Similar articles

References

    1. Denisenko TV, Budkevich IN, Zhivotovsky B. Cell death-based treatment of lung adenocarcinoma. Cell Death Dis. 2018;9(2):117. doi: 10.1038/s41419-017-0063-y; - DOI - PMC - PubMed
    1. Calvayrac O, Pradines A, Pons E, Mazieres J, Guibert N. Molecular biomarkers for lung adenocarcinoma. Eur Respir J. 2017;49(4):1601734. doi: 10.1183/13993003.01734-2016; - DOI - PubMed
    1. Travis WD, Brambilla E, Noguchi M, Nicholson AG, Geisinger KR, Yatabe Y, et al. International association for the study of lung cancer/american thoracic society/european respiratory society international multidisciplinary classification of lung adenocarcinoma. J Thorac Oncol. 2011;6(2):244–85. doi: 10.1097/JTO.0b013e318206a221; - DOI - PMC - PubMed
    1. Ruiz-Cordero R, Devine WP. Targeted therapy and checkpoint immunotherapy in lung cancer. Surg Pathol Clin. 2020;13(1):17–33. doi: 10.2217/imt.15.123. - DOI - PubMed
    1. Succony L, Rassl DM, Barker AP, McCaughan FM, Rintoul RC. Adenocarcinoma spectrum lesions of the lung: detection, pathology and treatment strategies. Cancer Treat Rev. 2021;99:102237. doi: 10.1016/j.ctrv.2021.102237; - DOI - PubMed

MeSH terms

Substances

LinkOut - more resources