Distribution Range and Richness of Plant Species Are Predicted to Increase by 2100 due to a Warmer and Wetter Climate in Northern China
- PMID: 40613311
- PMCID: PMC12232221
- DOI: 10.1111/gcb.70334
Distribution Range and Richness of Plant Species Are Predicted to Increase by 2100 due to a Warmer and Wetter Climate in Northern China
Abstract
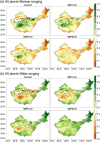
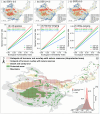
The warming global climate is threatening terrestrial ecosystem stability, including plant community structure and diversity. However, it remains unclear how distribution, richness, and turnover of plant species are impacted by warming and wetting in northern China. In the present study, species distribution models were applied to predict the spatial distribution of 5111 plant species based on 111,071 occurrence records in northern China. Additionally, variations in species richness and turnover rates were predicted for 2100 under 3 scenarios. The results indicated that approximately 70% of plant species will expand in their distribution, resulting in an increase in species richness. These changes will be driven mainly by temperature seasonality (TSN), annual precipitation (MAP), and mean temperature of the coldest quarter (MTCQ). However, about 30%-40% of the species will face extinction risks, including a considerable number of endemic and Red-Listed species, and suitable habitat loss (LSH) will exceed 30%. Narrow-ranging species will be more likely to lose a larger percentage of their suitable habitats than wide-ranging species, highlighting their sensitivity to environmental changes. Importantly, it emerged that species turnover rates will increase linearly with ecological vulnerability at the grid level, indicating that community structure and species composition are easily affected by climate change in ecologically vulnerable areas. Therefore, biodiversity hotspots with high species richness in the southern study areas, as well as regions exhibiting both fast species turnover and significant ecological vulnerability, should be prioritized for conservation. These findings provide insights into how species composition and richness in plant communities vary with global climate change and provide effective ecological conservation and management strategies.
Keywords: climate change; land cover; potential distribution range; species distribution model; species richness.
© 2025 The Author(s). Global Change Biology published by John Wiley & Sons Ltd.
Conflict of interest statement
The authors declare no conflicts of interest.
Figures


Similar articles
-
[Prediction of suitable habitats of Phlebotomus chinensis in Gansu Province based on the Biomod2 ensemble model].Zhongguo Xue Xi Chong Bing Fang Zhi Za Zhi. 2025 Jun 6;37(3):276-283. doi: 10.16250/j.32.1915.2024223. Zhongguo Xue Xi Chong Bing Fang Zhi Za Zhi. 2025. PMID: 40730525 Chinese.
-
Predicting the distribution of Blyth's kingfisher (Alcedo hercules) in the Eastern Himalayas: a climate-sensitive ensemble modelling approach.Environ Monit Assess. 2025 Jun 21;197(7):789. doi: 10.1007/s10661-025-14213-0. Environ Monit Assess. 2025. PMID: 40542908
-
The stability of plant richness, composition, and cover responds nonlinearly to warming in a decade-long experiment.Ecology. 2025 Jul;106(7):e70142. doi: 10.1002/ecy.70142. Ecology. 2025. PMID: 40620163
-
The Effects of Climate Change on Mesocarnivores: A Global Review and Meta-Analysis.Glob Chang Biol. 2025 Jun;31(6):e70302. doi: 10.1111/gcb.70302. Glob Chang Biol. 2025. PMID: 40515447 Review.
-
The Black Book of Psychotropic Dosing and Monitoring.Psychopharmacol Bull. 2024 Jul 8;54(3):8-59. Psychopharmacol Bull. 2024. PMID: 38993656 Free PMC article. Review.
References
-
- Ainsworth, E. A. , and Long S. P.. 2005. “What Have We Learned From 15 Years of Free‐Air CO2 Enrichment (FACE)? A Meta‐Analytic Review of the Responses of Photosynthesis, Canopy Properties and Plant Production to Rising CO2 .” New Phytologist 165, no. 2: 351–372. 10.1111/j.1469-8137.2004.01224.x. - DOI - PubMed
-
- Allouche, O. , Tsoar A., and Kadmon R.. 2006. “Assessing the Accuracy of Species Distribution Models: Prevalence, Kappa and the True Skill Statistic (TSS).” Journal of Applied Ecology 43, no. 6: 1223–1232. 10.1111/j.1365-2664.2006.01214.x. - DOI
MeSH terms
Grants and funding
- 32225032/National Natural Science Foundation of China
- 32271597/National Natural Science Foundation of China
- 23ZDKA0010/Key Research and Development Programs in Gansu Province
- 23ZDNA009/Key Research and Development Programs in Gansu Province
- 24ZD13NA016/Key Research and Development Programs in Gansu Province
LinkOut - more resources
Full Text Sources
Medical

