. 2025 Jul 4:13:RP98634.
doi: 10.7554/eLife.98634.

Multifaceted role of galanin in brain excitability

Affiliations

Multifaceted role of galanin in brain excitability

Nicolas N Rieser et al. Elife. .

Abstract

Galanin is a neuropeptide, which is critically involved in homeostatic processes like controlling arousal, sleep, and regulation of stress. This extensive range of functions aligns with implications of galanin in diverse pathologies, including anxiety disorders, depression, and epilepsy. Here, we investigated the regulatory function of galanin on whole-brain activity in larval zebrafish using wide-field Ca2+ imaging. Combining this with genetic perturbations of galanin signaling and pharmacologically increasing neuronal activity, we are able to probe actions of galanin across the entire brain. Our findings demonstrate that under unperturbed conditions and during epileptic seizures, galanin exerts a sedative influence on the brain, primarily through the galanin receptor 1 a (galr1a). However, exposure to acute stressors like pentylenetetrazole (PTZ) compromises galanin's sedative effects, leading to overactivation of the brain and increased seizure occurrence. Interestingly, galanin's impact on seizures appears to be bidirectional, as it can both decrease seizure severity and increase seizure occurrence, potentially through different galanin receptor subtypes. This nuanced interplay between galanin and various physiological processes underscores its significance in modulating stress-related pathways and suggests its potential implications for neurological disorders such as epilepsy. Taken together, our data sheds light on a multifaceted role of galanin, where galanin regulates whole-brain activity but also shapes acute responses to stress.

Keywords: brain imaging; epilepsy; galanin; glutamate transporter; neuroscience; zebrafish.


Conflict of interest statement

NR, MR, AH, SN No competing interests declared

Figures

Figure 1.
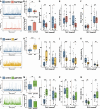
Figure 1.. gal expression correlates with whole-brain activity.
(A) Representative calcium signals (elavl3:GCaMP5G) recorded across the brain of 5 dpf control (eaat2a+/+) larva (blue, top) and eaat2a-/- mutant without seizure activity (red, bottom). (B) Area under the curve (AUC) calculated and averaged over two 5 min time windows per animal and normalized to control (n control = 25; n eaat2a-/- = 12). (C) Galanin transcript levels in pools of control vs. eaat2a-/- brains (n = 3). (D) Number of Ca2+ events above 5% ΔF/F0 (left) and 10% ΔF/F0 (right). (E) Average amplitude of Ca2+ events above 5% ΔF/F0 (left) and 10% ΔF/F0 (right) per larva. (F) Average duration of Ca2+ events above 5% ΔF/F0 (left) and 10% ΔF/F0 (right) per larva. (G) Representative calcium signals (elavl3:GCaMP6f) recorded across the brain of 5 dpf control (blue, top) and larvae 2 hr after pentylenetetrazole (PTZ) exposure (PTZ rebound) (magenta, bottom). (H) AUC calculated over 1 hr recording, normalized to control (n control = 21; n PTZ rebound = 21). (I) Galanin transcript levels in pools of control vs. PTZ rebound brains (n = 3). (G) Number of Ca2+ events above 5% ΔF/F0 (left) and 10% ΔF/F0 (right). (J) Average amplitude of Ca2+ events above 5% ΔF/F0 (left) and 10% ΔF/F0 (right) per larva. (K) Average duration of Ca2+ events above 5% ΔF/F0 (left) and 10% ΔF/F0 (right) per larva. Significance levels: ***p<0.001, **p<0.01, *p<0.05, ns = not significant (p>0.05), Wilcoxon-Mann-Whitney test (B, E, H, J, K), negative binomial regression (D, I), Student’s t-test (C, F).
Figure 2.
Figure 2.. gal controls whole-brain activity.
(A) Representative calcium signals (elavl3:GCaMP5G) recorded across the brain of 5 dpf control (blue, top) and hsp70l:gal sibling (orange, bottom). (B) Area under the curve (AUC) calculated over 1 hr recording, normalized to control (n control = 25; n hsp70l:gal = 29). (C) Galanin transcript levels in pools of control vs. hsp70l:gal brains (n = 3). (D) Number of Ca2+ events above 5% ΔF/F0 (left) and 10% ΔF/F0 (right). (E) Average amplitude of Ca2+ events above 5% ΔF/F0 (left) and 10% ΔF/F0 (right) per larva. (F) Average duration of Ca2+ events above 5% ΔF/F0 (left) and 10% ΔF/F0 (right) per larva. (G) Representative calcium signals (elavl3:GCaMP5G) recorded across the brain of 5 dpf control (blue, top) and gal-/- larva (yellow, bottom). (H) AUC calculated over 1 hr recording, normalized to control (n control = 24; n gal-/- = 24). (I) Number of Ca2+ events above 5% ΔF/F0 (left) and 10% ΔF/F0 (right). (J) Average amplitude of Ca2+ events above 5% ΔF/F0 (left) and 10% ΔF/F0 (right) per larva. (K) Average duration of Ca2+ events above 5% ΔF/F0 (left) and 10% ΔF/F0 (right) per larva. (L) Representative calcium signals (elavl3:GCaMP6f) recorded across the brain of 5 dpf control injected (blue, top) and galr1a crispants (galr1aKO) larva (green, bottom). (M) AUC calculated over 1 hr recording, normalized to control (n control = 28; n galr1a crispants = 23). (N) Galanin transcript levels in pools of control vs. galr1aKO brains (n = 3). (O) Number of Ca2+ events above 5% ΔF/F0 (left) and 10% ΔF/F0 (right). (P) Average amplitude of Ca2+ events above 5% ΔF/F0 (left) and 10% ΔF/F0 (right) per larva. (Q) Average duration of Ca2+ events above 5% ΔF/F0 (left) and 10% ΔF/F0 (right) per larva. Significance levels: ***p<0.001, **p<0.01, *p<0.05, ns = not significant (p>0.05), Wilcoxon-Mann-Whitney test (B, E, F, H, J, K, M, O, P), negative binomial regression (D).
Figure 2—figure supplement 1.
Figure 2—figure supplement 1.. Heat shock decreases brain activity of 5 dpf wild-type larvae.
(A) Representative calcium signals (elavl3:GCaMP5G) recorded across the brain of 5 dpf unexposed wild-type larva (blue, top) and 5 dpf wild-type larvae with a 37 °C heat shock for either 10 min (steelblue blue, middle) or 30 min (light blue, bottom) with different recovery times at room temperature. Significance levels: ***p<0.001, **p<0.01, *p<0.05, ns = not significant (p>0.05), Wilcoxon-Mann-Whitney test (C, D), negative binomial regression (B).
Figure 2—figure supplement 2.
Figure 2—figure supplement 2.. Immunostaining confirms protein deficiency in gal -/- mutants whole-mount immunostaining of galanin localized in the diencephalon of 5 dpf zebrafish larvae.
Antibodies used for staining included anti-galanin (green) and anti-ac. tubulin (acetylated tubulin, magenta). (A1) representative galanin staining in control larvae. (A2, A3) Single immunohistochemical channels. (B1) representative galanin staining in gal -/- larvae. (B2, B3) Single immunohistochemical channels. Scale bar = 25 μm.
Figure 3.
Figure 3.. gal Exerts a modest effect on seizure activity in eaat2a-/- mutants.
(A) Averaged calcium signals (elavl3:GCaMP5G) for spontaneous seizures recorded across the brain of 5 dpf control (eaat2a-/-) larva (blue, 35 events) and eaat2a-/-;hsp70l:gal (orange, 39 events) aligned by 50% of maximum amplitude. Shaded area represents SEM. (B) Time to peak calculated from beginning of aligned seizure until maximum ΔF/F0 signal. (C) Area under the curve (AUC) calculated over spontaneous seizures normalized to control (n control = 35; n eaat2a-/-;hsp70l:gal = 39). (D) Number of spontaneous seizures per larva. (E) Amplitude of spontaneous seizures per larva. (F) Duration of spontaneous seizures per larva. (G) Averaged calcium signals (elavl3:GCaMP5G) for spontaneous seizures recorded across the brain of 5 dpf control (eaat2a-/-) larva (blue, 77 events) and eaat2a-/-;gal-/- (yellow, 89 events) aligned by 50% of maximum amplitude. Shaded area represents SEM. (H) Time to peak calculated from beginning of aligned seizure until maximum ΔF/F0 signal. (I) AUC calculated over spontaneous seizures normalized to control (n control = 77; n eaat2a-/-;gal-/- = 89). (J) Number of spontaneous seizures per larva. (K) Amplitude of spontaneous seizures per larva. (L) Duration of spontaneous seizures per larva. Significance levels: ***p<0.001, **p<0.01, *p< 005, ns = not significant (p>0.05), Wilcoxon-Mann-Whitney test (B, C, E, F, H, I, K, L), negative binomial regression (D, J).
Figure 4.
Figure 4.. gal promotes seizures in pentylenetetrazole (PTZ) exposed larvae.
(A) Averaged calcium signals (elavl3:GCaMP6f) for seizures elicited by 20 mM PTZ recorded across the brain of 5 dpf control (blue, 76 events) and hsp70l:gal (orange, 113 events) aligned by 50% of maximum amplitude. Shaded area represents SEM. (B) Time to peak calculated from beginning of aligned seizure until maximum ΔF/F0 signal. (C) Area under the curve (AUC) calculated over seizures normalized to control (n control = 76; n hsp70l:gal = 113). (D) Number of seizures per larva. (E) Amplitude of seizures per larva. (F) Duration of seizures per larva. (G) Averaged calcium signals (elavl3:GCaMP6f) for seizures elicited by 20 mM PTZ recorded across the brain of 5 dpf control (blue, 29 events) and gal-/- (yellow, 10 events) aligned by 50% of maximum amplitude. Shaded area represents SEM. (H) Time to peak calculated from beginning of aligned seizure until maximum ΔF/F0 signal. (I) AUC calculated over seizures normalized to control (n control = 29; n gal-/- = 10). (J) Number of seizures per larva. (K) Amplitude of seizures per larva. (L) Duration of seizures per larva. (M) Averaged calcium signals (elavl3:GCaMP6f) for seizures elicited by 20 mM PTZ recorded across the brain of 5 dpf control injected (blue, seven events) and galr1a crispants (galr1aKO, green, 14 events) aligned by 50% of maximum amplitude. Shaded area represents SEM. (N) Time to peak calculated from beginning of aligned seizure until maximum ΔF/F0 signal. (O) AUC calculated over seizures normalized to control (n control = 7; n galr1a crispants = 14). (P) Number of seizures per larva. (Q) Amplitude of seizures per larva. (R) Duration of seizures per larva. Significance levels: ***p<0.001, **p<0.01, *p<0.05, ns = not significant (p>0.05), Wilcoxon-MannWhitnMann Whitney (B, C, E, F, H, I, K, L, N, O, Q, R), negative binomial regression (D, J, P).

Update of

References

    1. Adams AC, Clapham JC, Wynick D, Speakman JR. Feeding behaviour in galanin knockout mice supports a role of galanin in fat intake and preference. Journal of Neuroendocrinology. 2008;20:199–206. doi: 10.1111/j.1365-2826.2007.01638.x. - DOI - PubMed
    1. Akerboom J, Chen T-W, Wardill TJ, Tian L, Marvin JS, Mutlu S, Calderón NC, Esposti F, Borghuis BG, Sun XR, Gordus A, Orger MB, Portugues R, Engert F, Macklin JJ, Filosa A, Aggarwal A, Kerr RA, Takagi R, Kracun S, Shigetomi E, Khakh BS, Baier H, Lagnado L, Wang SS-H, Bargmann CI, Kimmel BE, Jayaraman V, Svoboda K, Kim DS, Schreiter ER, Looger LL. Optimization of a GCaMP calcium indicator for neural activity imaging. The Journal of Neuroscience. 2012;32:13819–13840. doi: 10.1523/JNEUROSCI.2601-12.2012. - DOI - PMC - PubMed
    1. Allen AS, Berkovic SF, Cossette P, Delanty N, Dlugos D, Eichler EE, Epstein MP, Glauser T, Goldstein DB, Han Y, Heinzen EL, Hitomi Y, Howell KB, Johnson MR, Kuzniecky R, Lowenstein DH, Lu Y-F, Madou MRZ, Marson AG, Mefford HC, Esmaeeli Nieh S, O’Brien TJ, Ottman R, Petrovski S, Poduri A, Ruzzo EK, Scheffer IE, Sherr EH, Yuskaitis CJ, Abou-Khalil B, Alldredge BK, Bautista JF, Berkovic SF, Boro A, Cascino GD, Consalvo D, Crumrine P, Devinsky O, Dlugos D, Epstein MP, Fiol M, Fountain NB, French J, Friedman D, Geller EB, Glauser T, Glynn S, Haut SR, Hayward J, Helmers SL, Joshi S, Kanner A, Kirsch HE, Knowlton RC, Kossoff EH, Kuperman R, Kuzniecky R, Lowenstein DH, McGuire SM, Motika PV, Novotny EJ, Ottman R, Paolicchi JM, Parent JM, Park K, Poduri A, Scheffer IE, Shellhaas RA, Sherr EH, Shih JJ, Singh R, Sirven J, Smith MC, Sullivan J, Lin Thio L, Venkat A, Vining EPG, Von Allmen GK, Weisenberg JL, Widdess-Walsh P, Winawer MR, Epi4K Consortium. Epilepsy Phenome/Genome Project De novo mutations in epileptic encephalopathies. Nature. 2013;501:217–221. doi: 10.1038/nature12439. - DOI - PMC - PubMed
    1. Atkinson LE, Liu Y, McKay F, Vandewyer E, Viau C, Irvine A, Rosa BA, Li Z, Liang Q, Marks NJ, Maule AG, Mitreva M, Beets I, Li L, Mousley A. Ascaris suum Informs extrasynaptic volume transmission in nematodes. ACS Chemical Neuroscience. 2021;12:3176–3188. doi: 10.1021/acschemneuro.1c00281. - DOI - PubMed
    1. Baraban SC, Taylor MR, Castro PA, Baier H. Pentylenetetrazole induced changes in zebrafish behavior, neural activity and c-fos expression. Neuroscience. 2005;131:759–768. doi: 10.1016/j.neuroscience.2004.11.031. - DOI - PubMed

LinkOut - more resources