. 2025 Jun 20;53(12):gkaf587.
doi: 10.1093/nar/gkaf587.

CTCF binding landscape is shaped by the epigenetic state of the N-terminal nucleosome in relation to CTCF motif orientation

Affiliations

CTCF binding landscape is shaped by the epigenetic state of the N-terminal nucleosome in relation to CTCF motif orientation

Md Tajmul et al. Nucleic Acids Res. .

Abstract

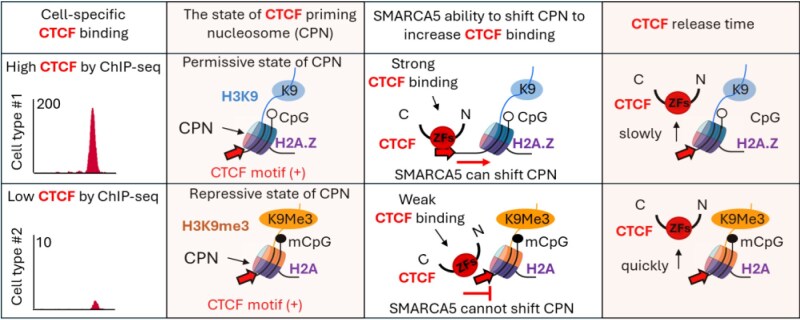
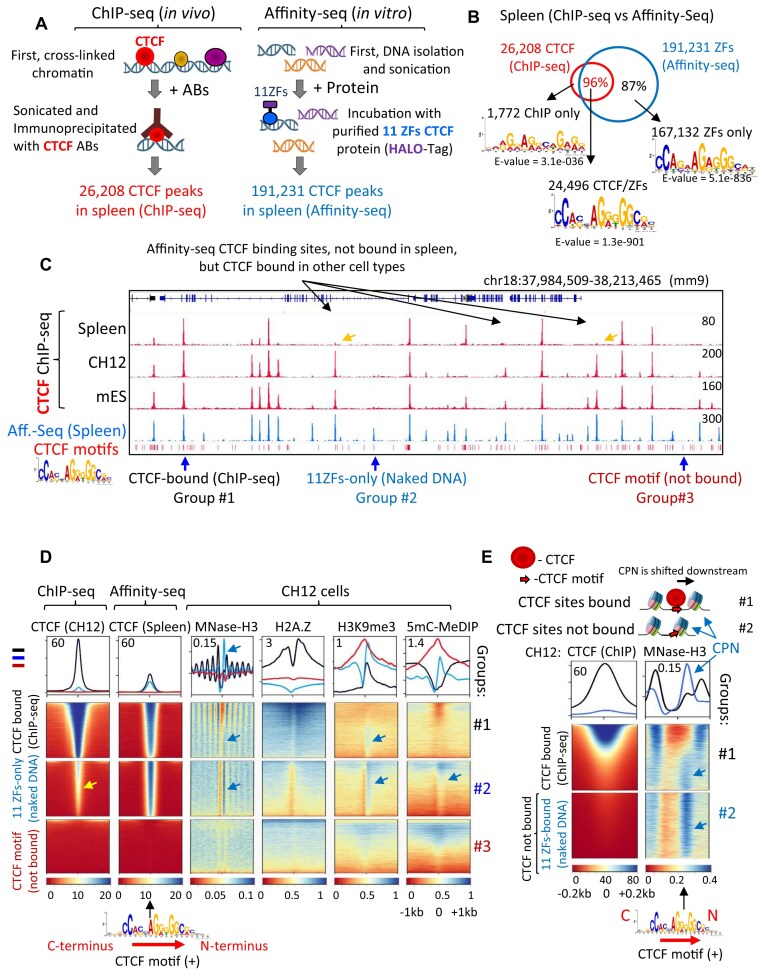
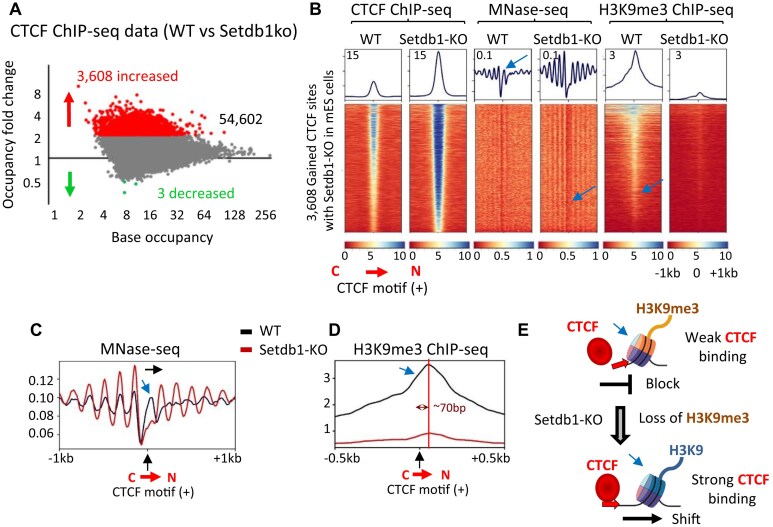
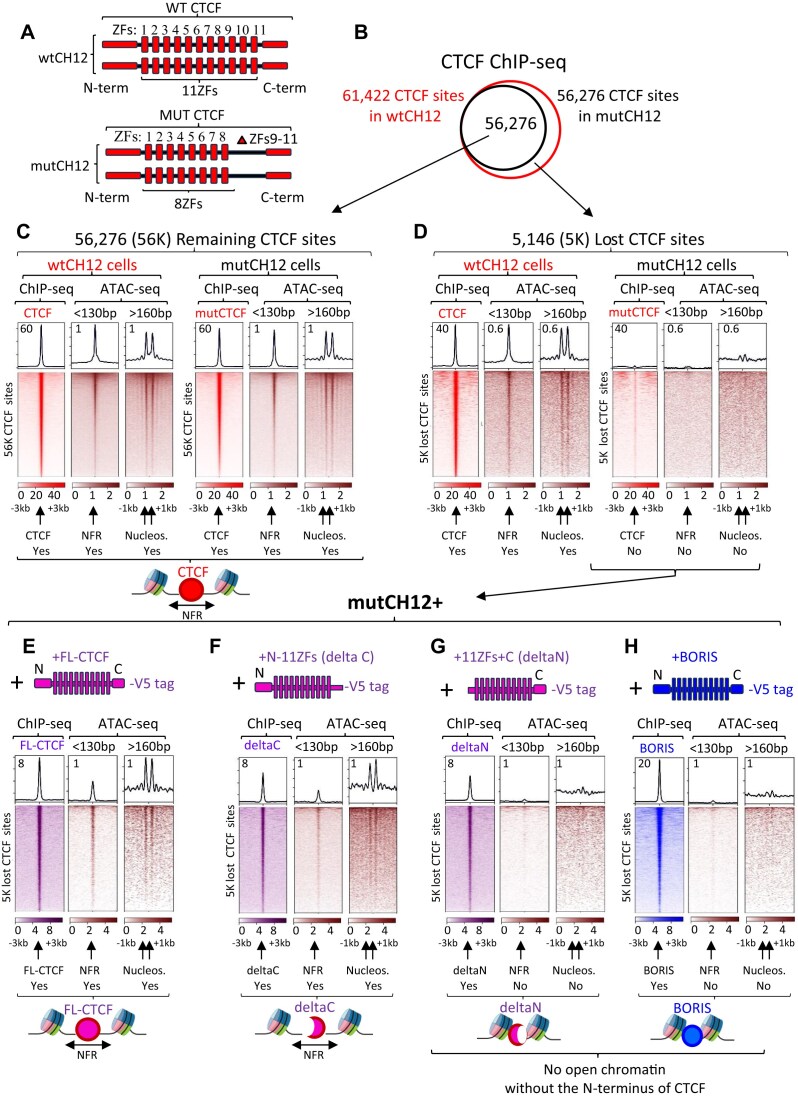
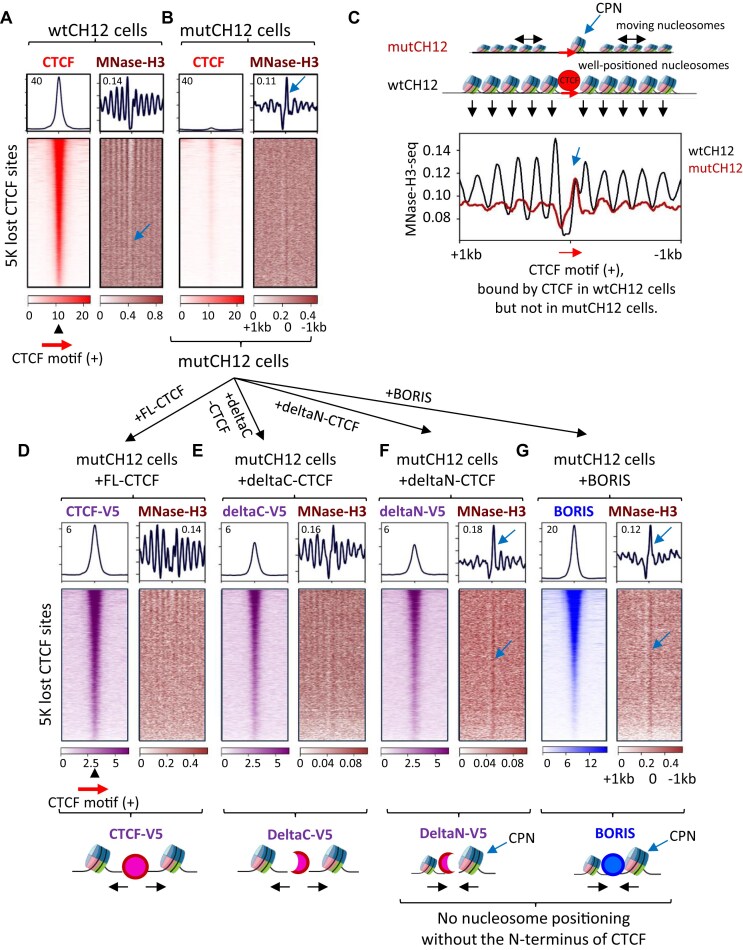
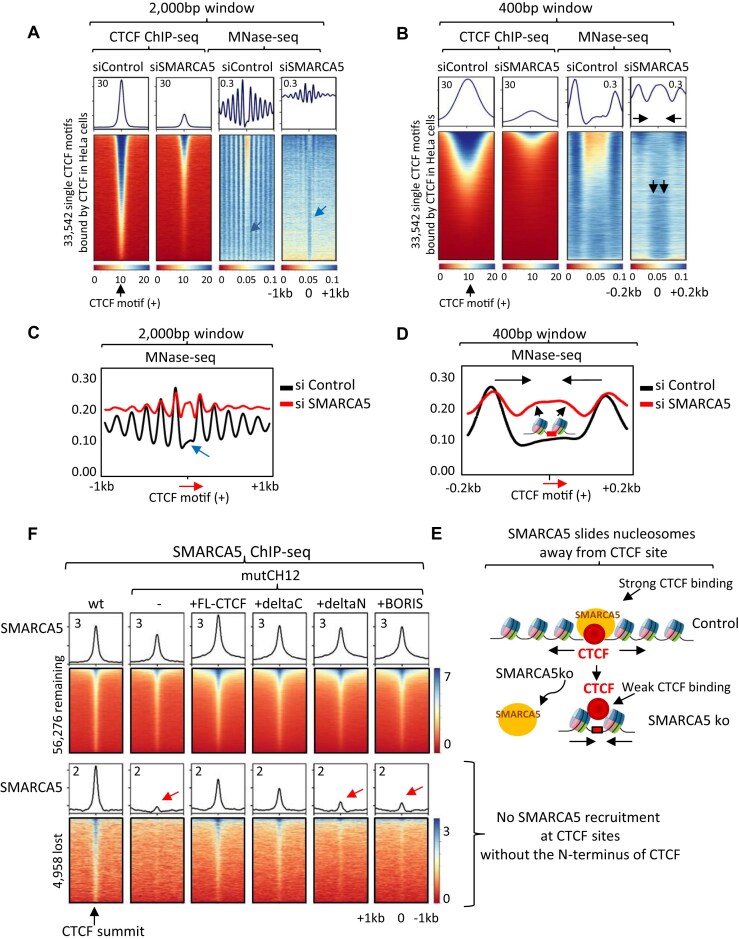
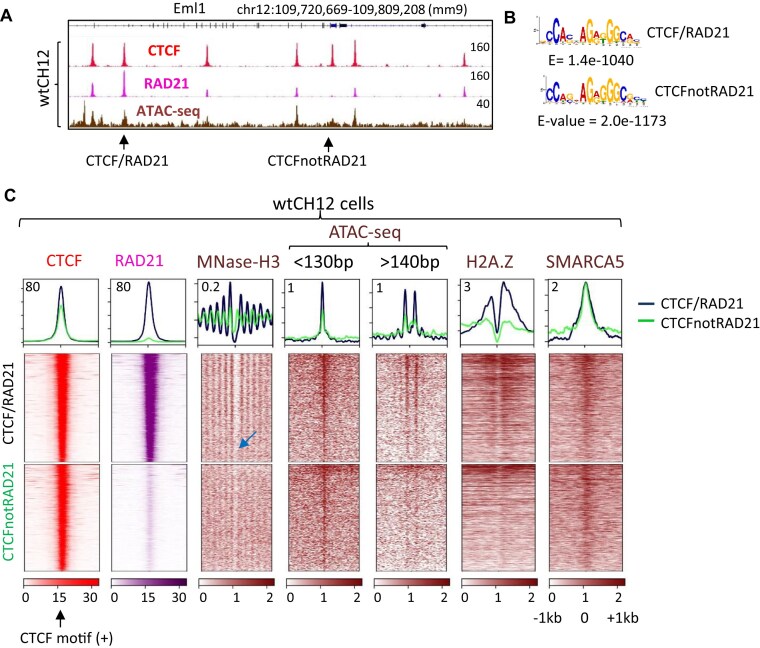
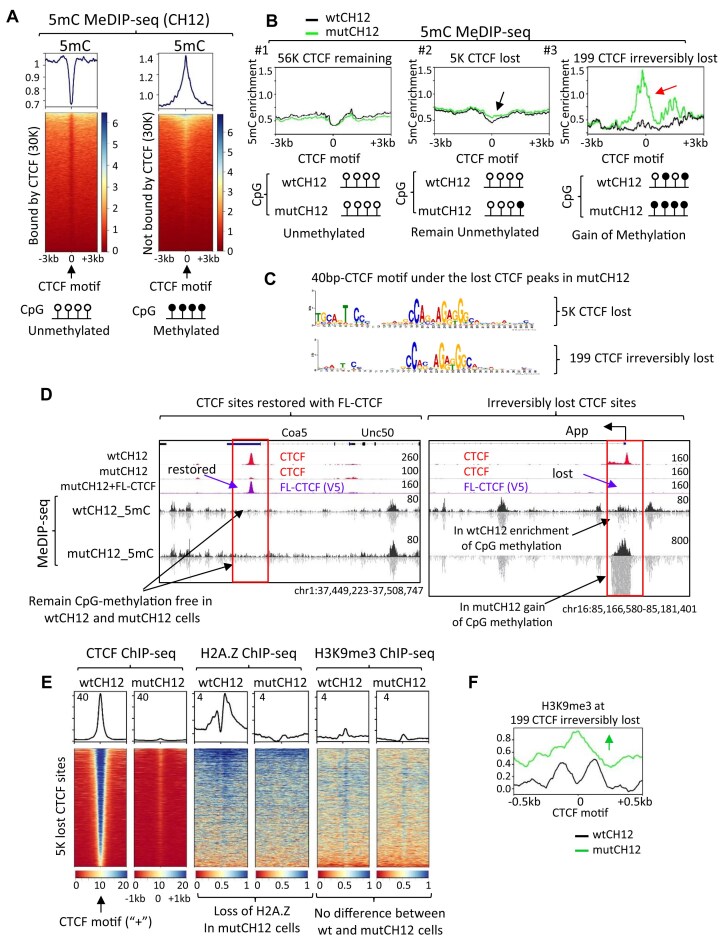
CTCF binding sites serve as anchors for the 3D chromatin architecture in vertebrates. The functionality of these anchors is influenced by the residence time of CTCF on chromatin, which is determined by its binding affinity and its interactions with nucleosomes and other chromatin-associated factors. In this study, we demonstrate that CTCF occupancy is driven by CTCF motifs, strategically positioned at the entry sides of a well-positioned nucleosome, such that, upon binding, the N-terminus of CTCF is oriented towards the nucleosome. We refer to this nucleosome as the CTCF priming nucleosome (CPN). Our analyses suggest that CTCF can more easily displace the CPN if the nucleosome is not marked by CpG methylation or repressive histone modifications. Under these permissive conditions, the N-terminus of CTCF recruits SMARCA5 to reposition the CPN downstream, thereby creating nucleosome-free regions that enhance CTCF occupancy and cohesin stalling. In contrast, when CPNs carry repressive epigenetic marks, CTCF binding is weaker, with no nucleosome displacement or chromatin opening, and cohesin is retained less effectively at CTCF binding sites. We propose that the epigenetic status of CPNs shapes cell-specific CTCF binding patterns, ensuring the maintenance of chromatin architecture throughout the cell cycle.


Conflict of interest statement

No potential conflict of interest was reported by the authors.

Figures

Graphical Abstract
Graphical Abstract
Figure 1.
Figure 1.
CTCF binding sites are strategically positioned at the entry side of well-positioned nucleosome. (A) Schematic comparison of ChIP-seq and Affinity-seq approaches used to map CTCF binding sites in mouse spleen. (B) Venn diagram illustrating the overlap between CTCF binding sites identified by ChIP-seq and Affinity-seq. MEME motifs enriched in each group of CTCF sites are indicated by black arrows. (C) Representative genome browser view displaying CTCF ChIP-seq data (red) compared to CTCF Affinity-seq data (Aff.-seq, blue). The red bars at the bottom show the 14bp-CTCF motif sequences present in the mouse genome (mm9). The yellow arrows indicate CTCF sites that were not detected by ChIP-seq in the spleen but were identified as CTCF-bound in Affinity-seq data from the spleen. Blue arrows highlight examples of CTCF binding sites categorized into three groups, as analyzed in panel (D). (D) Heatmaps centered on the CTCF motif in the plus (sense) orientation, showing (from left to right): CTCF ChIP-seq (CH12 cells), CTCF Affinity-seq (spleen), MNase-H3 nucleosome positioning (CH12), H3K9me3 ChIP-seq (CH12), and 5mC MeDIP-seq data (CH12 cells). These data are aligned across three groups of CTCF binding sites: (#1) CTCF-bound sites in CH12 cells (black), (#2) Affinity-seq recovered CTCF sites that were not identified as significant peaks by MACS in CTCF ChIP-seq of CH12 cells (blue), and (#3) CTCF motifs neither bound by CTCF nor recovered by Affinity-seq (red). The CPN is indicated by a blue arrow. The low CTCF ChIP-seq signal at the 11 ZFs-only group (#2) is shown by a yellow arrow. (E) A zoomed-in view of data from the panel (D), focusing on a 400 bp window centered on the plus CTCF motif. This panel combines CTCF ChIP-seq data with MNase-H3 data from CH12 cells to illustrate the downstream shift of well-positioned nucleosomes from the CTCF-bound motifs. At CTCF motifs recovered by Affinity-seq only, this nucleosome is positioned at the entry side of the plus CTCF motif (indicated by a blue arrow). A schematic representation of bound (#1) and unbound (#2) CTCF sites is provided at the top.
Figure 2.
Figure 2.
The loss of H3K9me3 at the CPN facilitates stable CTCF occupancy by removing repressive chromatin barriers, allowing for stronger binding. (A) MA plot showing CTCF occupancy (tag density) in wt versus Setdb1 KO mES cells. CTCF peaks are categorized, based on tag enrichment, as unchanged (gray), upregulated (red), or downregulated (green) in Setdb1-KO cells, compared to WT. Axes are displayed in log2 scale. (B) Heatmap centered on the CTCF motif in the plus orientation for 3608 gained CTCF sites identified in panel (A). The heatmap presents a comparative analysis of CTCF ChIP-seq, MNase-seq, and H3K9me3 ChIP-seq data at CTCF sites that gained occupancy in Setdb1-KO cells compared to WT cells. (Cand D) Profiles derived from panel (B) comparing nucleosome occupancy and histone modification enrichment at the 3608 gained CTCF sites in WT versus Setdb1-KO cells: (C) MNase-seq profile showing nucleosome positioning around CTCF motif in plus orientation. The potential shift of the CPN upon Setdb1-KO is indicated by a black arrow. (D) H3K9me3 ChIP-seq profile showing enrichment of H3K9me3 at the CPN. The position of the CPN relative to the beginning of the 14 bp CTCF motif in the plus orientation is indicated by a double-ended arrow and red line. (E) Schematic representation summarizing the conclusions: the loss of H3K9me3 at the CPN enhances CTCF binding stability. (B–E) The CPN is indicated by a blue arrow.
Figure 3.
Figure 3.
The loss of CTCF occupancy leads to reduced chromatin accessibility, a process dependent on the N-terminus of CTCF. (A) Schematic representations of wt and mutant CTCF proteins in wtCH12 and mutCH12 cells, respectively. The mutant CTCF has a homozygous deletion of ZFs 9–11 (ZFs 9–11). (B) Venn diagram illustrating the overlap of CTCF binding sites mapped by ChIP-seq in wtCH12 versus mutCH12 cells. (Cand D) Heatmaps showing CTCF occupancy in relation to chromatin accessibility (ATAC-seq) in wtCH12 and mutCH12 cells. The analysis focuses on sites where CTCF binding is either remained (C) or lost (D) in mutCH12 cells. Paired-end ATAC-seq reads were classified into short fragments (<130 bp), representing CTCF footprints, and nucleosome-sized fragments (>160 bp) to assess nucleosome positioning. (EH) Chromatin accessibility analysis in mutCH12 cells ectopically expressing different CTCF constructs: Full-length CTCF (FL-CTCF) (E), CTCF truncated at the C-terminus (deltaC) (F), CTCF truncated at the N-terminus (deltaN) (G), and human BORIS (H). At the top of each panel, a schematic representation of the ectopically expressed protein is displayed, mapped by ChIP-seq, with occupancy at the 5K lost CTCF sites visualized in heatmaps labeled “ChIP-seq.” At the bottom of each heatmap (C–H): The presence of NFRs and the two flanking nucleosomes (Nucleos.) around the summit of CTCF ChIP-seq data is indicated with black arrows. Labels “Yes” or “No” denote the presence or absence of these features. Below each panel is a schematic illustrating the proposed binding of the ectopically expressed protein in relation to nucleosome positioning and open chromatin states. The heatmaps (C–H) are centered at the summit of CTCF ChIP-seq peaks, spanning a 6 kb window for ChIP-seq data and a 2 kb window for ATAC-seq data.
Figure 4.
Figure 4.
Nucleosome positioning around CTCF binding sites depends on the N-terminus of CTCF. (Aand B) Heatmaps showing CTCF occupancy (ChIP-seq) combined with nucleosome positioning (MNase-H3), centered on the CTCF motif in the plus (sense) orientation. (A) Sites bound by CTCF in wtCH12 cells. (B) Sites lost in mutCH12 cells. (C) MNase-H3 ChIP-seq profile from panels (A) and (B) combined into a single plot, comparing nucleosome occupancy at the 5K lost CTCF sites in wtCH12 and mutCH12 cells. A schematic representation above the plot illustrates nucleosome positioning relative to the CTCF motif (red arrow) at the lost sites. (DG) Heatmaps displaying V5-tag density (D–F) or BORIS antibody (Ab) density combined with MNase-H3, following ectopic expression of the indicated CTCF vectors or BORIS in mutCH12 cells. Schematics at the bottom of the heatmaps illustrate the structural outcomes of CTCF truncations, with black arrows indicating the changes in nucleosome positioning and movement. (A–G) The CPN is indicated by blue arrows.
Figure 5.
Figure 5.
SMARCA5 is recruited by the N-terminus of CTCF to open chromatin around CTCF binding sites. (Aand B) Heatmaps showing CTCF occupancy (ChIP-seq) and nucleosome positioning (MNase-seq) in HeLa cells with SMARCA5 depletion (siSMARCA5) compared to control HeLa cells (siControl). The heatmaps are centered on CTCF bound motifs inside ChIP-seq peaks in HeLa cells within a window of 2000 bp (A) or 400 bp (B). The CPN is indicated by blue arrows, and the two flanking CTCF nucleosomes shifted toward the CTCF motif are marked by black arrows. (C and D) MNase-seq profiles of nucleosome positioning at CTCF-bound motifs in the plus orientation in HeLa cells with (red) and without (black) SMARCA5 depletion. Profiles are shown for windows of 2000 bp (C) and 400 bp (D). (E) Schematic representation illustrating the effects of SMARCA5 depletion on CTCF binding and nucleosome occupancy. (F) Heatmaps of SMARCA5 ChIP-seq data across two groups of CTCF binding sites: remaining CTCF sites (56 276) bound by CTCF in both wtCH12 and mutCH12 cells (top panel); 4958 (5K) lost CTCF sites in mutCH12 cells but restored by ectopic expression of FL-CTCF (lower panel). Red arrows indicate the absence of SMARCA5 occupancy at the lost CTCF sites in mutCH12 cells, ectopically expressing either the deltaN CTCF variant or BORIS.
Figure 6.
Figure 6.
The nucleosome-free accessible chromatin facilitates the halting of cohesin extrusion at CTCF binding sites. (A) Genome browser view displaying CTCF (red) and RAD21 (pink) ChIP-seq data alongside ATAC-seq data (brown) in wtCH12 cells. CTCF sites either depleted of cohesin (CTCFnotRAD21) or enriched with cohesin (CTCF/RAD21) are indicated by black arrows. (B) CTCF motifs identified within CTCFnotRAD21 and CTCF/RAD21 ChIP-seq peaks in wtCH12 cells. (C) Heatmaps centered on the CTCF motif in the plus (sense) orientation, showing (from left to right): CTCF ChIP-seq, RAD21 ChIP-seq, MNase-H3 nucleosome positioning, ATAC-seq data (with reads <130 bp indicative of CTCF footprint, and nucleosome-sized fragments >140 bp to determine nucleosome positioning), H2A.Z ChIP-seq, and SMARCA5 ChIP-seq at 1000 CTCF/RAD21 and CTCFnotRAD21 binding sites in wtCH12 cells. The CPN is indicated by blue arrow.
Figure 7.
Figure 7.
CTCF occupancy is shaped by the permissive epigenetic status around CTCF binding sites. (A) Heatmaps showing 5mC MeDIP-seq read alignment centered at CTCF motifs either bound by CTCF (left panel) or not bound by CTCF (right panel) in wtCH12 cells. Below the heatmaps, a schematic representation of CpG methylation status is provided, with open circles indicating unmethylated CpGs and filled black circles representing methylated CpGs, summarizing the data from the corresponding heatmaps. (B) Profile of 5mC MeDIP-seq across three groups of CTCF binding sites: (left panel) remaining CTCF sites (56 276) bound by CTCF in both wtCH12 and mutCH12 cells; (middle panel) 4958 lost CTCF sites (5K) in mutCH12 cells, which are restored by ectopic expression of FL-CTCF; and (right panel) 199 irreversibly lost CTCF sites. Black and red arrows indicate the gain of CpG methylation at the 5K lost CTCF sites and at the irreversibly lost CTCF sites, respectively. A schematic representation of CpG methylation status at the three groups of CTCF sites is shown below the 5mC profiles, highlighting that the irreversibly lost CTCF sites gained CpG methylation (filled black circles) in mutCH12 cells compared to wtCH12 cells. (C) The 40-bp MEME-recovered CTCF consensus sequence under the 5K lost CTCF sites compared to the 199 irreversibly lost CTCF sites. (D) Genome browser view of CTCF (red) and FL-CTCF-V5 (purple) ChIP-seq data combined with 5mC MeDIP-seq data in wtCH12 cells and mutCH12 cells. The restoration status of CTCF occupancy with ectopic expression of FL-CTCF (V5-Tag antibodies) in mutCH12 cells is indicated by purple arrows. Black arrows show the status of CpG methylation at the lost CTCF sites in wtCH12 versus mutCH12 cells. (E) Heatmaps of CTCF, H2A.Z, and H3K9me3 ChIP-seq data in wtCH12 cells versus mutCH12 cells at the 5K lost CTCF sites, centered on the CTCF motifs in the plus (sense) orientation. (F) Profile of H3K9me3 ChIP-seq data at the 199 irreversibly lost CTCF sites in wtCH12 cells (black) versus mutCH12 cells (green), centered at CTCF motifs. The green arrow highlights a gain of H3K9me3 in mutCH12 cells compared to wtCH12 cells.

Similar articles

References

    1. de Wit E, Vos ES, Holwerda SJ et al. CTCF binding polarity determines chromatin looping. Mol Cell. 2015; 60:676–84. 10.1016/j.molcel.2015.09.023. - DOI - PubMed
    1. Rao SS, Huntley MH, Durand NC et al. A 3D map of the human genome at kilobase resolution reveals principles of chromatin looping. Cell. 2014; 159:1665–80. 10.1016/j.cell.2014.11.021. - DOI - PMC - PubMed
    1. Klenova EM, Nicolas RH, Paterson HF et al. CTCF, a conserved nuclear factor required for optimal transcriptional activity of the chicken c-myc gene, is an 11-Zn-finger protein differentially expressed in multiple forms. Mol Cell Biol. 1993; 13:7612–24. - PMC - PubMed
    1. Kim TH, Abdullaev ZK, Smith AD et al. Analysis of the vertebrate insulator protein CTCF-binding sites in the human genome. Cell. 2007; 128:1231–45. 10.1016/j.cell.2006.12.048. - DOI - PMC - PubMed
    1. Chen H, Tian Y, Shu W et al. Comprehensive identification and annotation of cell type-specific and ubiquitous CTCF-binding sites in the human genome. PLoS One. 2012; 7:e41374. 10.1371/journal.pone.0041374. - DOI - PMC - PubMed

LinkOut - more resources