. 2025 Jul 4;28(3):40.
doi: 10.1007/s10456-025-09990-8.

In vivo profiling of the endothelium using 'AngioTag' zebrafish

Affiliations

In vivo profiling of the endothelium using 'AngioTag' zebrafish

Mayumi F Miller et al. Angiogenesis. .

Abstract

Vascular endothelial cells in vivo are exquisitely regulated by their local environment, which is disrupted or absent when using methods such as FACS sorting of cells isolated from animals or in vitro cell culture. Here, we profile the gene expression patterns of undisturbed endothelial cells in living animals using a novel "AngioTag" zebrafish transgenic line that permits isolation of actively translating mRNAs from endothelial cells in their native environment. This transgenic line uses the endothelial cell-specific kdrl promoter to drive expression of an epitope tagged Rpl10a 60 S ribosomal subunit protein, allowing for Translating Ribosome Affinity Purification (TRAP) of actively translating endothelial cell mRNAs. By performing TRAP-RNAseq on AngioTag animals, we demonstrate strong enrichment of endothelial-specific genes and have uncovered both novel endothelial genes and unique endothelial gene expression signatures for different adult organs. Finally, we generated a versatile "UAS: RiboTag" transgenic line to allow a wider array of different zebrafish cell and tissue types to be examined using TRAP-RNAseq methods. These new tools offer an unparalleled resource to study the molecular identity of cells in their normal in vivo context.

Keywords: Endothelial cell profiling; RiboTag; TRAP-RNAseq; Translatome; Zebrafish.


Conflict of interest statement

Declarations. Competing interests: The authors declare no competing interests. Ethics approval: Zebrafish husbandry and research protocols were reviewed and approved by the NICHD Animal Care and Use Committee at the National Institutes of Health (ASP # 24 − 015). All animal studies were carried out according to NIH-approved protocols, in compliance with the Guide for the Care and use of Laboratory Animals.

Figures
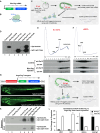
Fig. 1
Fig. 1
Affinity-tagged ribosomal protein subunits (Ribotags) can be used to purify translated RNAs in vivo. A Schematic diagram of the egfp-2a-rpl10a3xHA RiboTag cassette. B Schematic diagram of a 3xHA-tagged ribosome translating an mRNA. C Schematic diagram illustrating the workflow for TRAP purification of RNAs from RiboTag mRNA-injected zebrafish. D Western blot of starting lysates and TRAP supernatants and eluates from either control or RiboTag-injected animals, probed with αHA antibody. IgG light chain is present in the pull-downs. E Western blots of fractions collected from sucrose density gradient sedimentation of lysates from control or RiboTag-injected animals, probed with either αRpl11 or αHA. HA-tagged ribosomes sediment together with Rpl11-positive polysomes in the RiboTag-injected samples. F Western blots of fractions collected from sucrose gradient sedimentation of EDTA-treated lysates from control or RiboTag-injected animals, probed with either αRpl11 or αHA. Rpl11-positive endogenous ribosomes and HA-tagged ribosomes both sediment in the 60S fraction after EDTA treatment. G Schematic diagram of the IsceI(kdrl:egfp-2a-rpl10a3xHA) transgene. H Composite confocal micrograph of a 3dpf Tg(kdrl:egfp)la116 transgenic animal, for comparison purposes. I Composite confocal micrograph of a 3dpf Tg(kdrl:egfp-2a-rpl10a3xHA)y530 (“AngioTag”) transgenic animal. J Schematic diagram illustrating the workflow for TRAP purification of RNAs from AngioTag zebrafish. K Western blot of starting lysates and TRAP supernatants and eluates from either control or AngioTag animals, probed with αHA antibody, showing longer (top) and shorter (bottom) exposures of the same blot. IgG light chain is present in the pull-downs. L Quantitative RT-PCR measurement of the relative expression of endothelial genes cdh5 and kdrl, and non-endothelial genes desma and neurog1 in cDNA samples prepared from TRAP purified RNA from either RiboTag control (black columns) or AngioTag (white columns) animals, showing enrichment of vascular specific genes and depletion of non-vascular specific genes in the AngioTag TRAP samples
Fig. 2
Fig. 2
Comparative workflow for preparation of endothelial-specific RNAs using fluorescence activated cell sorting (FACS) versus translating ribosome affinity purification (TRAP). A Workflow for FACS of EGFP-positive endothelial cells and RNA preparation from 24hpf Tg(kdrl:egfp-2a-rpl10a3xHA)y530 AngioTag transgenic animals (sample #4 in panel C). RNA is collected from the cells after more than 1½ hours of embryonic dissociation and cell sorting. B Workflow for TRAP of translated mRNAs from 24hpf egfp-2a-rpl10a3xHA RiboTag mRNA-injected animals (sample #2 in panel C) or Tg(kdrl:egfp-2a-rpl10a3xHA)y530 (AngioTag) transgenic animals (sample #6 in panel C). Lysates are prepared from intact animals, and the RNA is stabilized immediately at the beginning of the procedure. C Samples collected in triplicate for RNAseq analysis. 24hpf RiboTag mRNA injected (samples 1 and 2), dissociated AngioTag transgenic (samples 3, 4), or AngioTag transgenic animals (samples, 5, 6). Part of each sample was used for whole lysate total RNA collection (samples 1, 3, and 5). The remainder of each sample was used for either TRAP purification of total (sample 2) or endothelial (sample 6) polysome mRNA, or for FACS sorting of EGFP-positive endothelial cells followed by RNA isolation (sample 4). D Principal component analysis of RNAseq data obtained from the six sample types noted in panel C, each run in triplicate (total of 18 samples). The greatest variance is seen between those samples in which cells were dissociated (samples 3 and 4) and those that were not (samples 1, 2, 5, 6)
Fig. 3
Fig. 3
Comparison of the whole-animal transcriptome to its translatome. A Samples collected for RNAseq analysis of whole animal translatome (sample 2) vs. whole animal transcriptome (sample 1) from 24 hpf RiboTag mRNA injected animals. B Top 10 GO terms for the highest-translated genes based on average fold increase. C Percent change of codon usage between the most highly translated genes (log2(fold) > 0.35, BH-adjusted p < 0.05 comparing samples 2 vs. 1) and the least highly translated genes (log2(fold) < − 0.35, BH-adjusted p < 0.05 comparing samples 2 vs. 1). The color-coding scheme shows the percent change in the relative usage of each codon between the two sets of genes with the usage of each codon calculated as a percentage of the total number of codons coding for a particular amino acid. D Scatter plot comparing our findings of codon usage to those discussed in Horstick et al. [40]. The plot shows strong correlation between codon usage from high translated genes in our data set and high transcribed genes from Horstick et al. (r2 = 0.95)
Fig. 4
Fig. 4
Translating Ribosome Affinity Purification shows greater endothelial gene enrichment compared to Fluorescence Activated Cell Sorting. A Samples collected from 24 hpf AngioTag transgenic animals dissociated into a cell suspension, for RNAseq analysis of mRNA from either FACS sorted endothelial cells (sample 4) or unsorted input cells (sample 3). B Volcano plot of endothelial enrichment using the sample comparison shown in panel A. C Top twenty GO terms for genes most highly enriched in the FACS sorted endothelial cell samples vs. whole animal dissociated unsorted cells. Three out of the top twenty GO terms represent endothelial process-related terms (in red text). D Samples collected for RNAseq analysis of TRAP purified endothelial cell polysome mRNA from 24 hpf AngioTag transgenic animals (sample 6) normalized to its input total mRNA (sample 5) compared to TRAP purified total embryonic polysome mRNA from 24 hpf RiboTag mRNA injected animals (sample 2) normalized to its input total mRNA (sample 1). E Volcano plot of endothelial enrichment using the sample comparison shown in panel D. F Top twenty GO terms for genes most highly enriched in the TRAP purified endothelial polysome mRNA samples. Nine out of the top twenty GO terms represent endothelial process-related terms (in red text) compared to only three seen with FACS sorted endothelial cells in panel C. G Log2 fold enrichment of endothelial specific genes and depletion of non-endothelial specific genes in AngioTag TRAP-RNAseq sample 6 (normalized to 5) as compared to RiboTag TRAP-RNAseq sample 2 (normalized to 1)
Fig. 5
Fig. 5
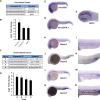
TRAP-RNAseq reveals novel endothelial genes expressed in early vascular development. A Three annotated genes enriched in the AngioTag TRAP-RNAseq dataset (sample 6) without previously recognized endothelial expression. B Log2 fold enrichment of the three annotated genes noted in panel A in AngioTag TRAP-RNAseq sample 6 (normalized to 5) compared to RiboTag TRAP-RNAseq sample 2 (normalized to 1). C–E Whole mount in situ hybridization of 24 hpf wild type zebrafish probed for exoc312a (C), slcc22a7b.1 (D), and bpifcl (E). Images shown are either lateral views of the whole animal (panels C-D), or a dorsal view of the head with staining of the heart noted (E). F Four unannotated genes enriched in the AngioTag TRAP-RNAseq data set (sample 6). G Log2 fold enrichment of the four unannotated genes noted in panel F in AngioTag TRAP-RNAseq sample 6 (normalized to 5) compared to RiboTag TRAP-RNAseq sample 2 (normalized to 1). H–O Whole mount in situ hybridization of 24 hpf wild type zebrafish probed for unannotated gene A (panels H-I), gene B (panels J-K), gene C (panels L-M), and gene D (panels N–O). Images shown are lateral views of the whole animal (panels H, J, L, N), with higher magnification lateral views of the trunk (panels I, K, M, O)
Fig. 6
Fig. 6
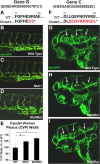
Mutants of unannotated endothelial genes have vascular phenotypes. A In 76721y587 mutants a 5 bp deletion in ENSDARG00000076721 introduces an early stop codon, resulting in a protein truncation from 316 amino acids to 78 amino acids. B–D Confocal microscopy of 3dpf embryos from a 76721y587/+ heterozygous in-cross showing a dilated caudal plexus in heterozygous (C) and homozygous mutant (D) embryos as compared to wild type siblings (B). E Graph comparing the caudal plexus height of wild type, 76721y587/+ heterozygous, and 76721y587/y587 homozygous mutant siblings. Values shown are the percent change compared to wild type (N = 41 wild types, 58 heterozygotes, 23 homozygous mutants). F In 98293y588 mutants a 20 bp deletion in ENSDARG00000098293 introduces an early stop codon, resulting in a protein truncation from 104 amino acids to 27 amino acids. G–I Confocal microscopy of 3dpf wild type (G) and 98293y588/y588 homozygous mutant embryos (HI) reveals decreased cranial vasculature in mutant embryos compared to wild type (white arrows). * student’s t-test p-value ≤ 0.05
Fig. 7
Fig. 7
Endothelial profiling using TRAP-RNAseq reveals common vasculature signatures and unique gene expression profiles across vascular beds of different organs. A Samples collected for RNAseq analysis of TRAP purified endothelial cell polysome mRNA from five different organs, skin, muscle, liver, heart, brain, and whole fish of AngioTag transgenic animals normalized to each organ’s input total mRNA. B Heatmap displaying common endothelial genes enriched in the vasculature of the whole fish (WF) and across vascular beds of each organ compared to their input controls colored by their gene-wise z-scores of the log-transformed normalized counts. TRAP pulldown (IP) and total organ mRNA (input) for each replicate for each organ are shown. C–G Confocal images of adult Tg(kdrl:egfp)la116 transgenic fish with hybridization chain reaction (HCR) in situ of cdh5 showing expression of kdrl (white) and cdh5 (magenta) in the vasculature of the skin (C), muscle (D), liver (E), heart (F), and brain (G). Merged and cdh5 only channels are shown. White arrowheads indicate cdh5 transcript expression while yellow arrowheads show blood cell autofluorescence. H Schematic depicting screening steps used to determine genes unique to the vascular beds of each organ. To be included genes first had to be enriched in the vasculature of an organ compared to its total tissue and vascular expression in that organ had to be greater than vascular expression in the whole fish. Gene sets then underwent pairwise comparisons between each organ to determine if they were shared or unique to a particular organ. I Heatmap displaying unique endothelial genes enriched in the vascular beds of each organ colored by their gene-wise z-scores of the log-transformed normalized counts. TRAP pulldowns (IP) for each replicate for each organ are shown. J–L Confocal images of adult Tg(kdrl:egfp)la116 transgenic fish (white) with hybridization chain reaction (HCR) in situ of ackr3a (magenta) in the brain (J), flt4 (magenta) in the liver (K), and scarb2b (magenta) and cav1 (blue) in the muscle (L). White solid arrowheads indicate probe expression in the vessel, and white open arrowheads indicate probe expression in the muscle fiber. Scale bars are 25μm
Fig. 8
Fig. 8
TRAP profiling can determine gene expression in different tissues and cell types using Ribotag Reporter transgenics. A Schematic diagram of the Tol2(uas:egfp-2a-rpl10a2xHA) RiboTag Reporter transgene. B Green epifluorescence photomicrograph of a 30hpf Tg(uas:egfp-2a-rpl10a2xHA)y531; Tg(xa210:gal4)y241 double transgenic animal. C Green epifluorescence photomicrograph of a 3dpf Tg(uas:egfp-2a-rpl10a2xHA)y531; Tg(fli1a:gal4ff)ubs4 double transgenic animal. D Green epifluorescence photomicrograph of a 6dpf Tg(uas:egfp-2a-rpl10a2xHA)y531; Tg(huc:gal4) double transgenic animal. E Schematic diagram illustrating the workflow for TRAP purification of RNAs from RiboTag Reporter zebrafish crossed to Gal4 driver lines. F Quantitative RT-PCR measurement of the relative expression of the endothelial-specific kdrl gene in samples prepared from TRAP purified RNA from Tg(uas:egfp-2a-rpl10a2xHA)y531; Tg(fli1a:gal4ff)ubs4 double-transgenic animals compared to RNA prepared whole embryo lysates from the same animals. G Quantitative RT-PCR measurement of the relative expression of the neural-specific snap25 gene in samples prepared from TRAP purified RNA from Tg(uas:egfp-2a-rpl10a2xHA)y531;Tg(huc:gal4) double-transgenic animals compared to RNA prepared whole embryo lysates from the same animals

References

    1. Gore AV, Monzo K, Cha YR, Pan W, Weinstein BM (2012) Vascular development in the zebrafish. Cold Spring Harb Perspect Med 2(5):a006684. 10.1101/cshperspect.a006684 - PMC - PubMed
    1. Jung HM, Isogai S, Kamei M, Castranova D, Gore AV, Weinstein BM (2016) Imaging blood vessels and lymphatic vessels in the zebrafish. Methods Cell Biol 133:69–103. 10.1016/bs.mcb.2016.03.023 - PubMed
    1. Swift MR, Pham VN, Castranova D, Bell K, Poole RJ, Weinstein BM (2014) SoxF factors and Notch regulate nr2f2 gene expression during venous differentiation in zebrafish. Dev Biol 390(2):116–125. 10.1016/j.ydbio.2014.03.018 - PMC - PubMed
    1. Swift MR, Weinstein BM (2009) Arterial-venous specification during development. Circ Res 104(5):576–588. 10.1161/CIRCRESAHA.108.188805 - PubMed
    1. Lawson ND, Scheer N, Pham VN, Kim CH, Chitnis AB, Campos-Ortega JA, Weinstein BM (2001) Notch signaling is required for arterial-venous differentiation during embryonic vascular development. Development 128(19):3675–3683 - PubMed

MeSH terms

LinkOut - more resources