. 2025 Jul 15;39(13):e70759.
doi: 10.1096/fj.202501128R.

Resistance and Aerobic Preconditioning Delays Unloading-Induced Multisystemic Physiological Changes: The NEBULA Project

Affiliations

Resistance and Aerobic Preconditioning Delays Unloading-Induced Multisystemic Physiological Changes: The NEBULA Project

Théo Fovet et al. FASEB J. .

Abstract

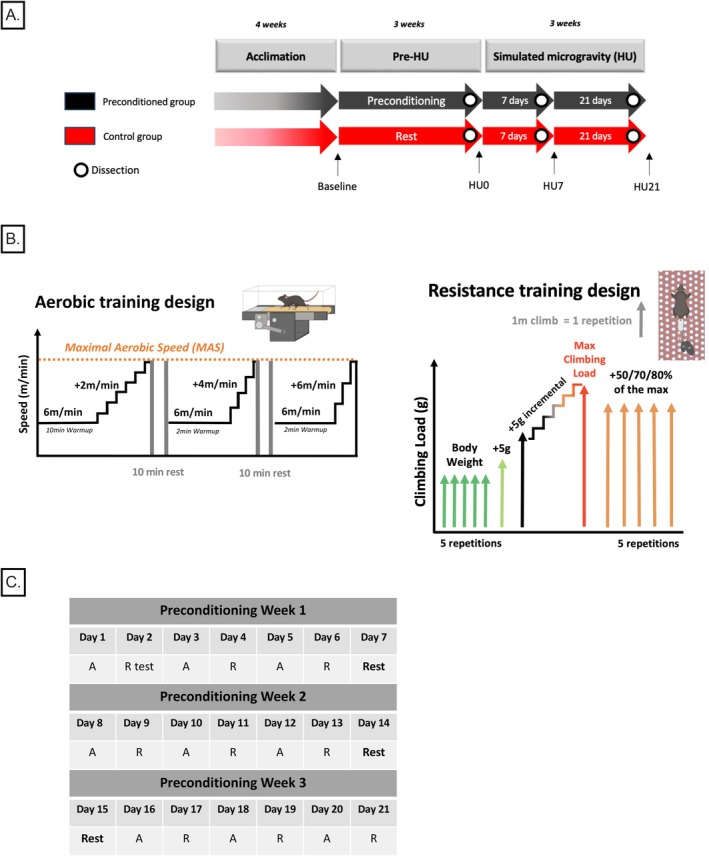
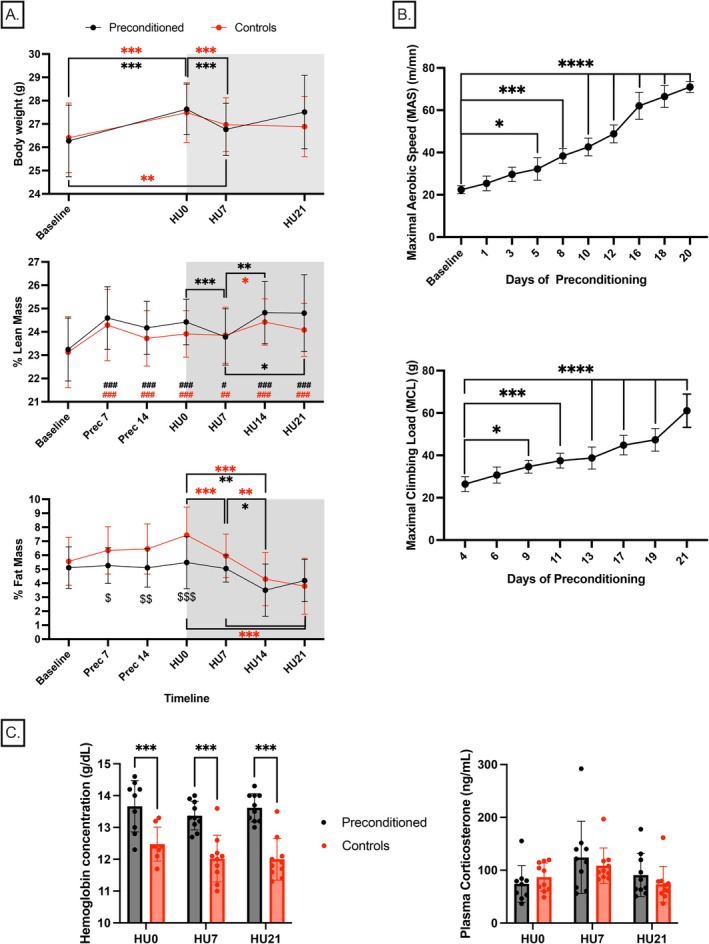
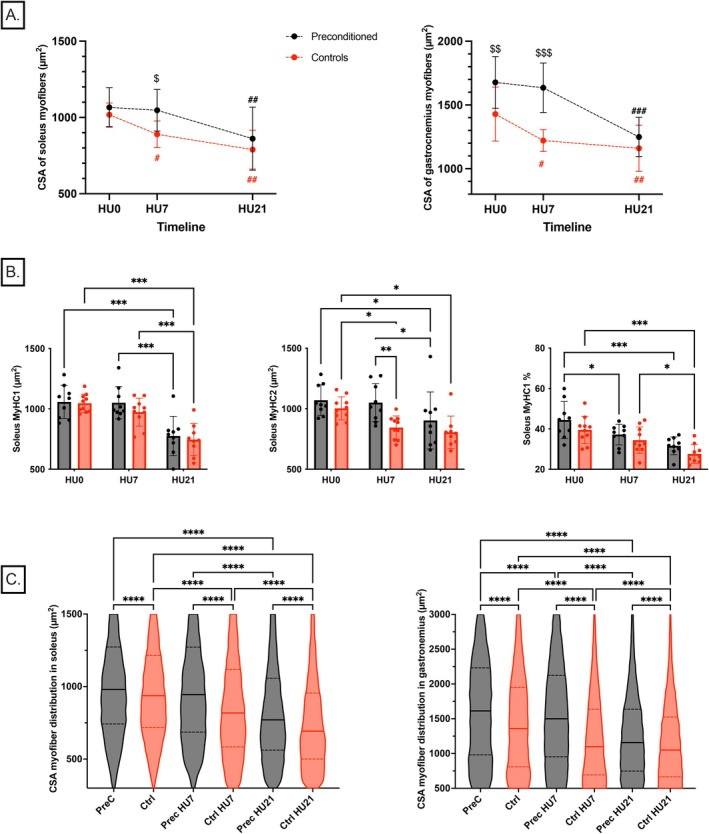
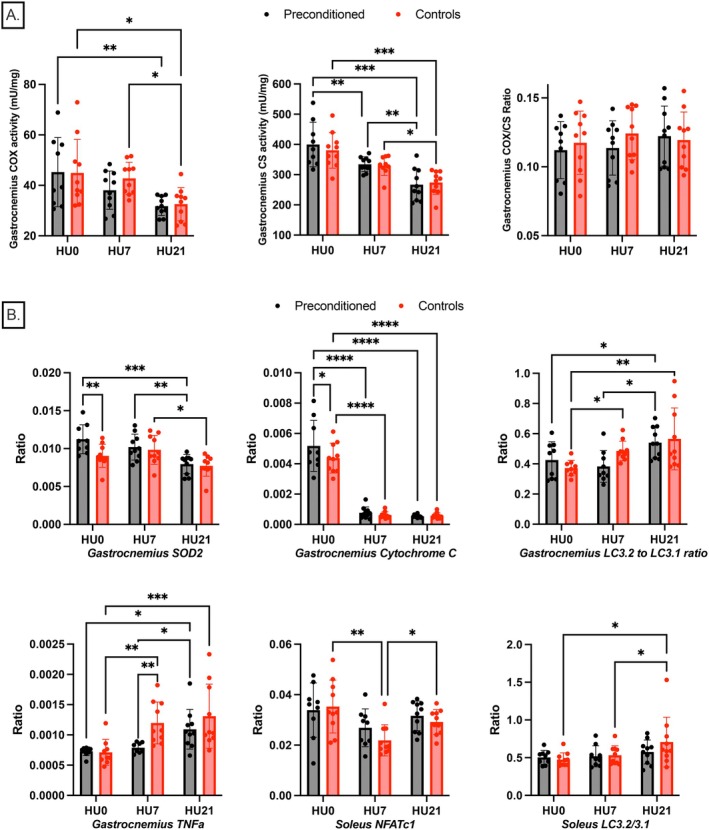
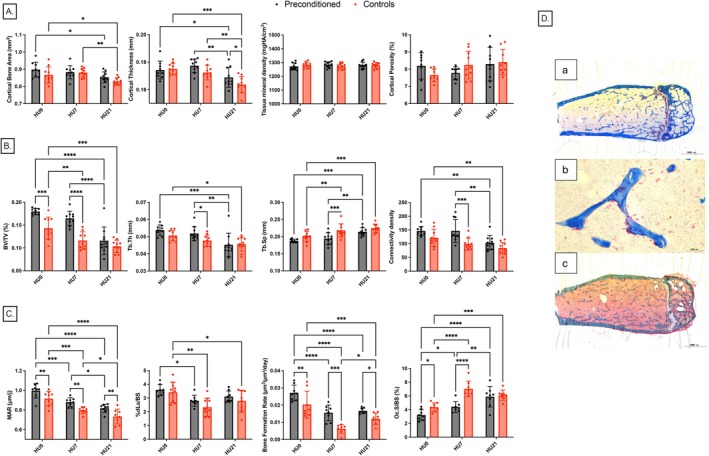
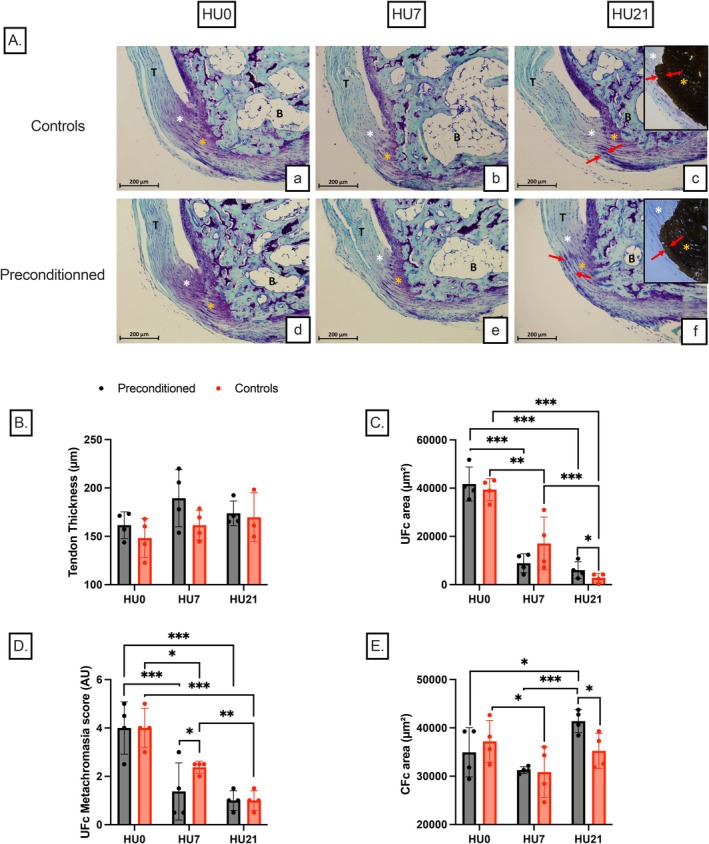
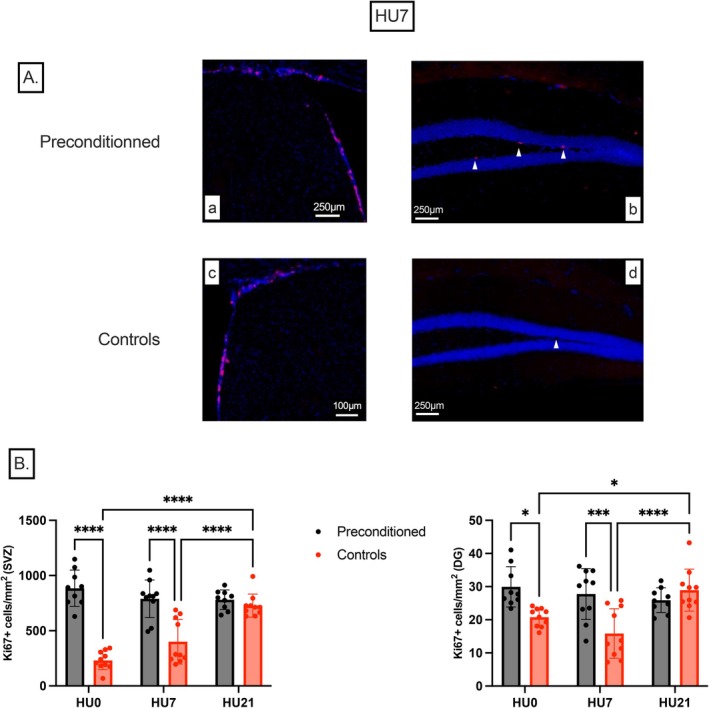
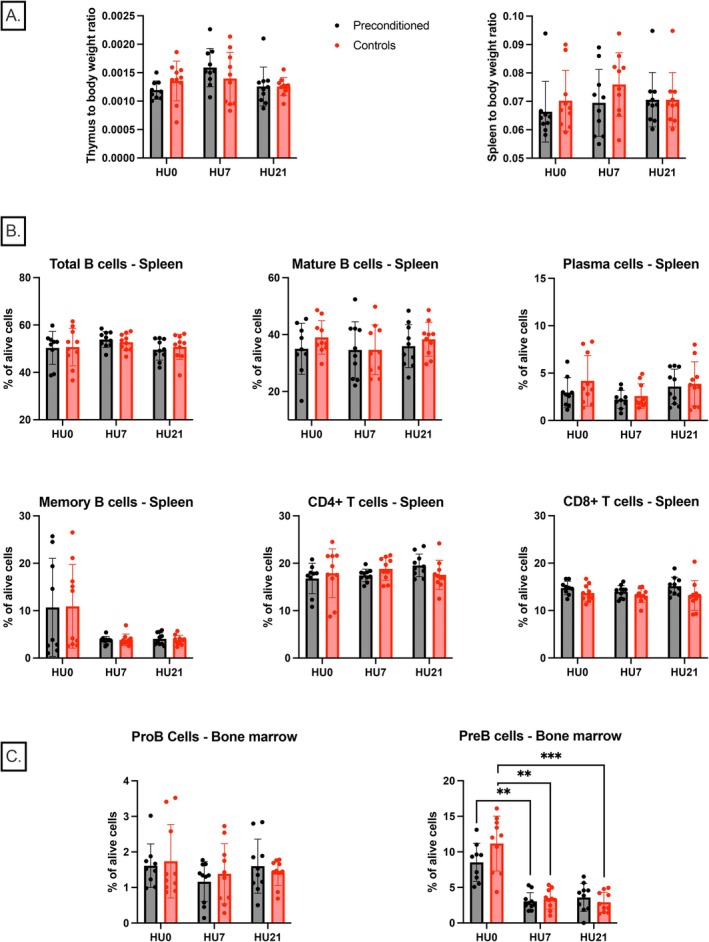
Spaceflight is considered an extreme environment, and from the first days of flight, microgravity causes significant modifications in several physiological systems, particularly the musculoskeletal, cardiovascular, immunological, and nervous systems. To safeguard astronauts' health on upcoming trips, it is crucial to better counteract microgravity's effects using the best prevention methods. With this objective, we launched the NEBULA (Nutrition and Exercise Biology for UnLoaded Astronauts) collaborative research project. The first phase of NEBULA investigates whether a targeted high-intensity pre-flight training program (preconditioning) can delay physiological deconditioning during the initial days of microgravity in a preclinical model. To assess this, sixty 16-week-old male C57BL/6J mice were split into 6 groups (n = 10, each). Half underwent three weeks of preconditioning training (PreC), while the other half remained untrained (Ctrl). Both groups then experienced either 7 or 21 days of hindlimb unloading (HU). Tissue samples-including muscle, bone, tendon, bone marrow, spleen, serum, and brain-were collected at three key time points: post-preconditioning (HU0), after 7 days of HU (HU7), and after 21 days of HU (HU21). At HU0, the PreC group exhibited significantly improved physical performance and enhanced musculoskeletal mass and architecture compared to Ctrl. In the Ctrl group, HU induced severe bone and muscle deconditioning by HU7, which was worsened by HU21. However, in the PreC group, the initial improvements in bone and muscle structure were maintained through HU7 before declining by HU21. Importantly, the high intensity and frequency of training did not negatively impact tendon integrity or immune function and appeared to prevent the decline in adult neurogenesis typically associated with both intense exercise and microgravity. These findings highlight the broad systemic benefits of pre-flight physical conditioning in delaying the adverse effects of reduced mechanical load, such as those experienced during spaceflight or prolonged bed rest. Additionally, they underscore the potential for preconditioning to support more effective countermeasures when physical exercise is unavailable for extended periods.

Keywords: countermeasure; hindlimb unloading; multisystemic; physical exercise; preconditioning; spaceflight.


Conflict of interest statement

The authors declare no conflicts of interest.

Figures

FIGURE 1
FIGURE 1
Organization chart, schedule, and training protocol. (A) Design of the study. (B) Summary diagram of the aerobic and resistance training protocol. (C) Schedule of Aerobic (A) and Resistance (R) training over the 3 weeks of preconditioning.
FIGURE 2
FIGURE 2
Body composition analysis, physical performance, and blood analysis. (A) In vivo body composition measurement using EchoMRI, including bodyweight (g), fat mass (%), and lean mass (%). (B) Maximal physical performance evolution during the 3 weeks of preconditioning, including Maximal Aerobic Speed (MAS; m/min) and the Maximal Climbing Load (MCL; g). (C) Hemoglobin blood concentration measurement (g/dL) and Corticosterone plasma concentration (ng/mL). $Significant difference between groups at the same timepoint. #Significant difference with baseline; *p < 0.05; **p < 0.01; ***p < 0.001; ****p < 0.0001. Ctrl group: red label; PreC group: black label.
FIGURE 3
FIGURE 3
Effect of resistance and aerobic training on myofiber typing and CSA. (A) Evaluation of soleus and gastrocnemius muscle atrophy through myofiber cross‐sectional area measurements (CSA; μm2). (B) Soleus myofiber CSA by fiber type (μm2) and percentage of type 1 (MyHC1) (%). (C) Myofiber distribution by CSA value (violin plot with mean and quartiles) in soleus and gastrocnemius muscles. #Significant differences versus HU0. $Significant difference between groups at the same timepoint. *p < 0.05; **p < 0.01; ***p < 0.001; ****p < 0.0001. Ctrl group: red label; PreC group: black label.
FIGURE 4
FIGURE 4
Effect of resistance and aerobic training on muscle protein content and enzymological activities. (A) Gastrocnemius enzymological analysis, measurement of COX activity (Cytochrome C Oxidase; mU/mg), CS activity (Citrate synthase; mU/mg), and COX/CS ratio. (B) Gastrocnemius and soleus protein content evaluation through western blot analysis (ratio with stain‐free in arbitrary units). *p < 0.05; **p < 0.01; ***p < 0.001; ****p < 0.0001. Ctrl group: red label; PreC group: black label.
FIGURE 5
FIGURE 5
Effect of resistance and aerobic training on femoral bone microarchitecture and histomorphometric indices of bone formation and resorption. (A) MicroCT cortical parameters including Cortical Bone Area (Ct.Ar; mm2), Cortical Thickness (Ct.Th; mm), Tissue Mineral Density (TMD; mghA/cm3), and Cortical Porosity (Ct.Po; %). (B) MicroCT parameters of trabecular parameters including Trabecular Bone Volume (BV/TV; %), Trabecular Thickness (Tb.Th; mm), Trabecular Separation (Tb.N; 1/mm), and Connectivity Density (Conn. D.; 1/mm3). (C) Histomorphometric indices of bone formation: Mineral Apposition Rate (MAR; μm/day), Bone Formation Rate (BFR/BS; μm3/μm2/day), and Doubled‐labeled Surface (dL.S/BS, %); Histomorphometric indices of bone resorption: Osteoclast Surface (Oc.S/BS, %). (D) Typical images of histomorphometric histological staining (a and b: TRAcP staining labeling; c: Goldner labeling). *p < 0.05; **p < 0.01; ***p < 0.001; ****p < 0.0001. Ctrl group: red label; PreC group: black label.
FIGURE 6
FIGURE 6
Effect of resistance and aerobic training on the Achilles tendon enthesis. (A) Toluidine blue paraffin sections counterstained with fast green at HU0 (a, d), HU7 (b, e), and HU21 (c, f) for the Preconditioned group (d–f) and Control group (a–c), physical preconditioning. Inserts in (c) and (f) show undecalcified resin sections sequentially stained with toluidine blue and Von Kossa, showing that the region between the two tidemarks is calcified. White asterisk: UFc; Orange asterisk: CFc; Red arrows: Tidemark; T: Tendon; B: Bone. (B) Achilles tendon thickness at the level of the calcaneal tuberosity (μm). (C) Uncalcified fibrocartilage (UFc) area (μm2). (D) Intensity score (0 to 5) of metachromasia on the uncalcified fibrocartilage (UFc). (E) Calcified fibrocartilage (CFc) area (μm2). *p < 0.05; **p < 0.01; ***p < 0.001. Ctrl group: red label; PreC group: black label.
FIGURE 7
FIGURE 7
Effect of resistance and aerobic training on cell proliferation in the brain. (A) Typical images of Ki67 (red) and DAPI (blue) labeling in brain slices in the subventricular zone (SVZ) (a, c) and dental gyrus of the hippocampus (b, d) (scale bar: 250 μm). (B) Density of Ki67 positive cells in the mouse brain subventricular zone (SVZ) and dentate gyrus of the hippocampus (DG). *p < 0.05; ***p < 0.001; ****p < 0.0001. Ctrl group: red label; PreC group: black label.
FIGURE 8
FIGURE 8
Effect of resistance and aerobic training on the immune system. (A) Thymus and spleen to body weight ratio. (B) Spleen total B cells, mature B cells, plasma cells, memory B cells, CD4+ T cells, and CD8+ T cells (% of alive cells). (C) Bone marrow ProB and PreB percentage of alive cells. **p < 0.01; ***p < 0.001. Ctrl group: red label; PreC group: black label.

Similar articles

References

    1. Lang T., Van Loon J. J. W. A., Bloomfield S., et al., “Towards Human Exploration of Space: The THESEUS Review Series on Muscle and Bone Research Priorities,” npj Microgravity 3 (2017): 8, 10.1038/s41526-017-0013-0. - DOI - PMC - PubMed
    1. Vernikos J., “Human Physiology in Space,” BioEssays: News and Reviews in Molecular, Cellular and Developmental Biology 18, no. 12 (1996): 1029–1037, 10.1002/bies.950181215. - DOI - PubMed
    1. Ratushnyy A. Y. and Buravkova L. B., “Microgravity Effects and Aging Physiology: Similar Changes or Common Mechanisms?,” Biochemistry. Biokhimiia 88, no. 11 (2023): 1763–1777, 10.1134/S0006297923110081. - DOI - PubMed
    1. Takamatsu Y., Koike W., Takenouchi T., et al., “Protection Against Neurodegenerative Disease on Earth and in Space,” npj Microgravity 2 (2016): 16013, 10.1038/npjmgrav.2016.13. - DOI - PMC - PubMed
    1. Liphardt A.‐M., Fernandez‐Gonzalo R., Albracht K., Rittweger J., and Vico L., “Musculoskeletal Research in Human Space Flight – Unmet Needs for the Success of Crewed Deep Space Exploration,” npj Microgravity 9, no. 1 (2023): 1–7, 10.1038/s41526-023-00258-3. - DOI - PMC - PubMed

LinkOut - more resources