. 2025 Jul 4;11(27):eadg3481.
doi: 10.1126/sciadv.adg3481. Epub 2025 Jul 4.

Integrated in vivo functional screens and multiomics analyses identify α-2,3-sialylation as essential for melanoma maintenance

Affiliations

Integrated in vivo functional screens and multiomics analyses identify α-2,3-sialylation as essential for melanoma maintenance

Praveen Agrawal et al. Sci Adv. .

Abstract

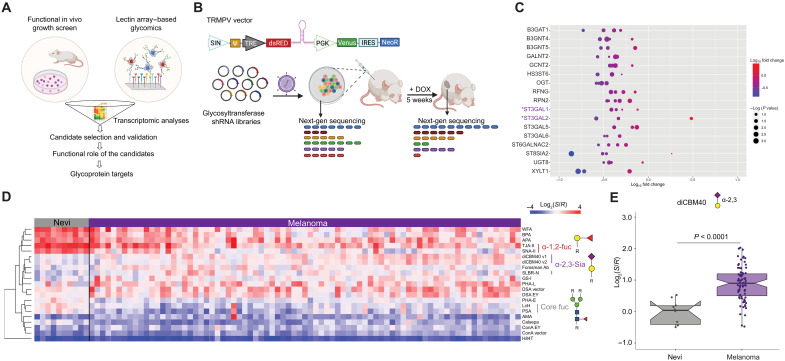
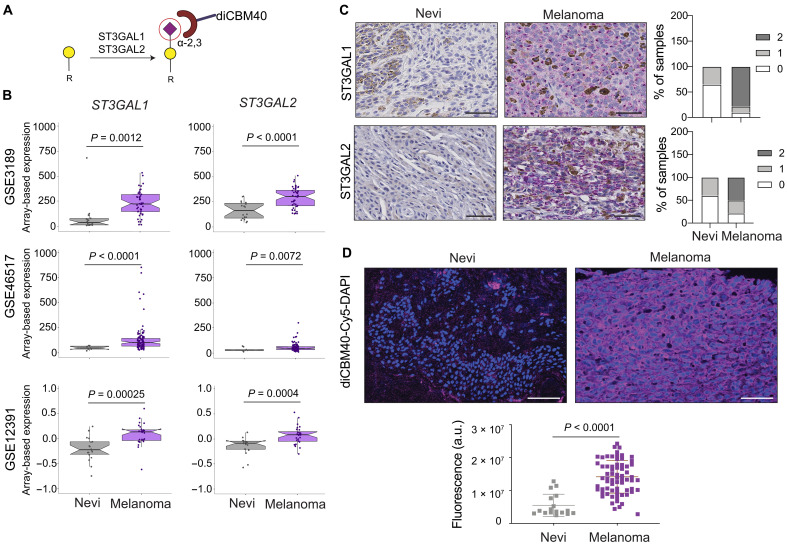
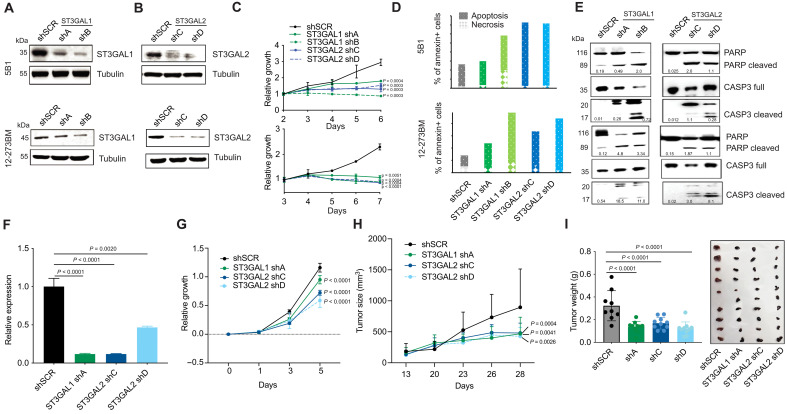
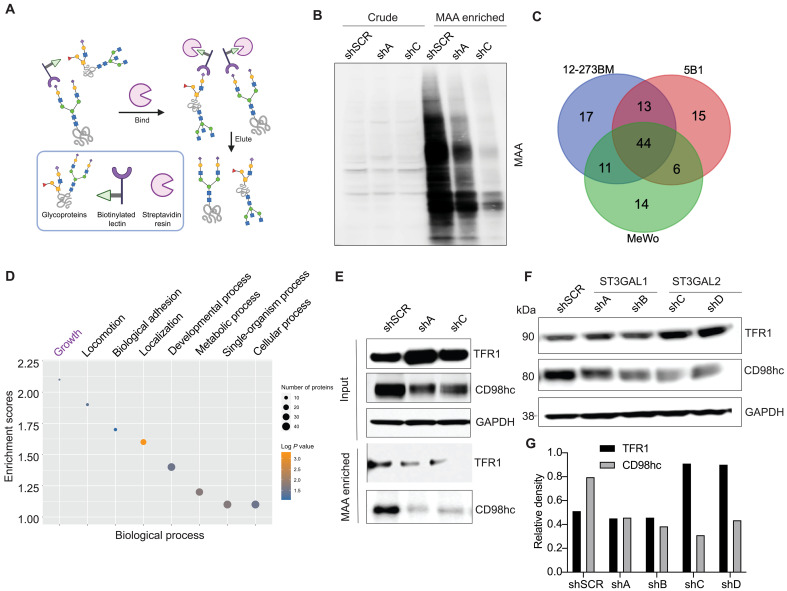
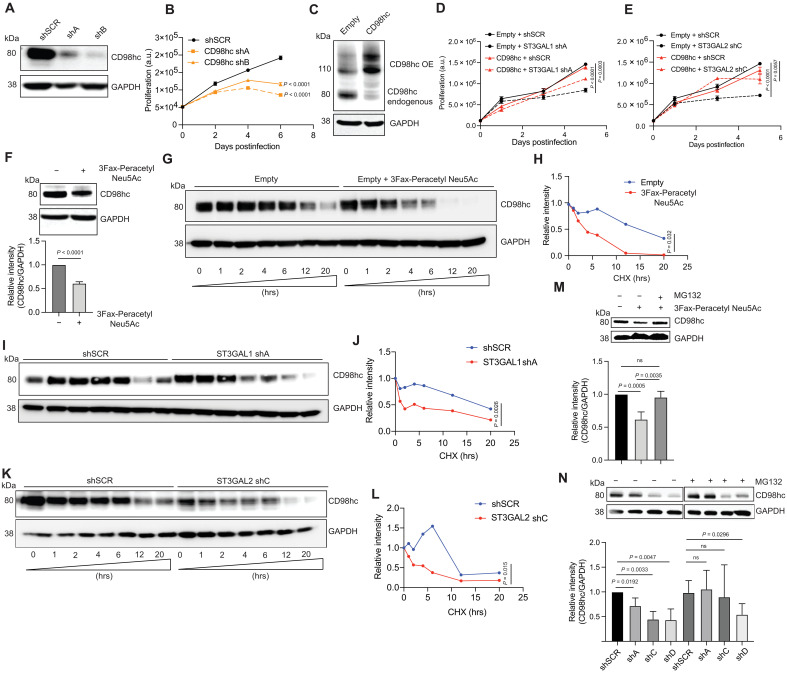
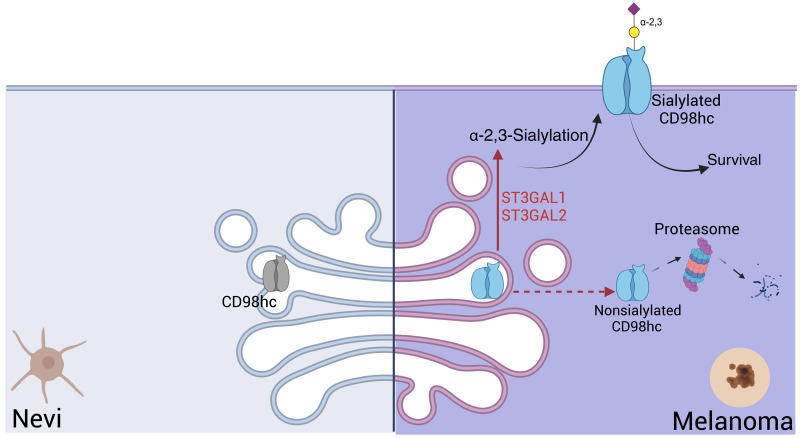
Aberrant glycosylation is a hallmark of cancer biology, and altered glycosylation influences multiple facets of melanoma progression. To identify glycosyltransferases, glycans, and glycoproteins essential for melanoma maintenance, we conducted an in vivo growth screen with a pooled short hairpin RNA library of glycosyltransferases, lectin microarray profiling of benign nevus and melanoma samples, and mass spectrometry-based glycoproteomics. We found that α-2,3-sialyltransferases ST3GAL1 and ST3GAL2 and corresponding α-2,3-linked sialosides are up-regulated in melanoma compared to nevi and are essential for melanoma growth. Glycoproteomics revealed that glycoprotein targets of ST3GAL1 and ST3GAL2 are enriched in transmembrane proteins involved in growth signaling, including the amino acid transporter SLC3A2/CD98hc. CD98hc suppression mimicked the effect of ST3GAL1 and ST3GAL2 silencing, inhibiting melanoma cell proliferation. We found that both CD98hc protein stability and its prosurvival effect on melanoma are dependent upon α-2,3-sialylation mediated by ST3GAL1 and ST3GAL2. Our studies reveal α-2,3-sialosides functionally contributing to melanoma maintenance, supporting ST3GAL1 and ST3GAL2 as therapeutic targets in melanoma.


Figures

Fig. 1.
Fig. 1.. In vivo functional genetic screen and multiomics approach identify essential glycogenes and glycans for melanoma growth.
(A) Schematic illustration of our approach to identifying glycosylation enzymes involved in melanoma growth and their targets. (B) Schematic representation of dual-color TRINE vector that enables Tet-regulated shRNA expression to suppress glycosyltransferases involved in cell proliferation and survival. The in vivo growth screen schema is also presented. (C) Bubble plot representing log10 fold change of the depleted or enriched shRNA in the MeWo cells transduced with glycosyltransferase shRNA libraries in tumors (5 weeks postinjection) relative to the baseline (before injection). Glycosyltransferases corresponding to α-2,3-sialylation are highlighted in purple. (D) Heatmap of ratiometric lectin microarray data for nevus (n = 10) and melanoma FFPE tissues (n = 79); only lectins showing significant differences between the two groups are shown [Student’s t test (two-tailed), P < 0.05]. Pink, log2(S/R) > log2(Smedian/Rmedian); blue, log2(Smedian/Rmedian) > log2(S/R). Lectins corresponding to α-2,3-sialosides are highlighted in purple. The complete heatmap is shown in fig. S2A. (E) Whisker plot showing significantly increased diCBM40 binding in melanoma compared to nevi. Significance was determined using Wilcoxon’s t test.
Fig. 2.
Fig. 2.. ST3GAL1, ST3GAL2, and α-2,3-sialosides are up-regulated in melanoma relative to nevi.
(A) α-2,3-Sialylated glycans generated by ST3GAL1 and ST3GAL2 and recognized by diCBM40 lectin. (B) Whisker plots illustrating significant up-regulation of ST3GAL1 and ST3GAL2 mRNA expression in melanoma samples compared to nevi in multiple datasets: GSE3189 (98), GSE46517 (99), and GSE12391 (100). Two-tailed unpaired t test. (C) Representative images of IHC staining with ST3GAL1 and ST3GAL2 antibodies in 15 nevus and 50 melanoma samples show a perinuclear staining pattern (Fast Red counterstaining). The IHC score was calculated by combining the signal intensity and percentage of positive cells within the section. The histogram shows the distribution of ST3GAL1 and ST3GAL2 IHC scores in nevus and melanoma samples. Scale bars, 10 μm. (D) Representative images of diCBM40 lectin fluorescence microscopy of nevus and melanoma FFPE tissues (n = 17 for nevi and 68 for melanomas). diCBM40-Alexa Fluor 647 (magenta) and DAPI-stained sections of the tissue microarray. Scale bars, 100 μm. a.u., arbitrary units. Dot plots represent the average fluorescence intensity of five fields per image (two-tailed unpaired t test).
Fig. 3.
Fig. 3.. ST3GAL1 and ST3GAL2 are essential for melanoma proliferation in vitro and in vivo.
ST3GAL1 (A) and ST3GAL2 (B) in 5B1 and 12-273BM cells stably transduced with nontargeting scrambled control (shSCR), ST3GAL1 (shA or shB), or ST3GAL2 (shC or shD) shRNAs were assessed by WB. Images are representative of three independent experiments. (C) Relative growth curves of 5B1 and 12-273BM cells stably transduced with control (shSCR), ST3GAL1 (shA or shB), or ST3GAL2 (shC or shD) shRNAs. Representative data from three independent experiments are shown. (D) Percentage of melanoma cells positive for annexin V only (early apoptosis) or PI only (necrosis). The experiment was performed in duplicate, and the average is shown. (E) Representative WB for caspase-3 and PARP for 5B1 and 12-273BM cells treated with shRNA against ST3GAL1 and ST3GAL2. The experiment was conducted in duplicate. Quantification of the cleaved PARP/total PARP ratio and cleaved caspase/total caspase ratio displayed. An additional replicate is provided in fig. S6I. (F) ST3GAL1 and ST3GAL2 transcript levels in MeWo cells stably expressing shRNA targeting ST3GAL1 (shA), ST3GAL2 (shC or shD), or shSCR were assessed by real-time qPCR. The graph shows average relative expression normalized to GAPDH, with three replicates per condition. Data are representative of three independent experiments. (G) Relative growth curves of MeWo cells stably transduced with control (shSCR), ST3GAL1 (shA), or ST3GAL2 (shC or shD) shRNAs. Data are representative of three independent experiments. (H) Primary tumor growth of MeWo cells transduced with ST3GAL1 (shA) or ST3GAL2 shRNAs (shC or shD) or shNTC following subcutaneous injection into NSG mice (n = 10 mice per condition). (I) Average tumor mass and picture of resected tumors taken 28 days postinjection. For (C), (F), and (G), P values from two-tailed unpaired t tests are shown. For (H) and (I), two-way analysis of variance (ANOVA) and Tukey’s multiple comparisons test were performed, and P values are shown.
Fig. 4.
Fig. 4.. Identification of α-2,3-sialylated glycoproteins in melanoma reveals regulators of melanoma growth.
(A) Schematic illustration of the experimental approach showing affinity enrichment of α-2,3-sialylated proteins by MAA lectin affinity chromatography. (B) MAA affinity chromatography of whole-cell lysates of 5B1 cells transduced with SCR (scrambled) or ST3GAL1/ST3GAL2 shRNA followed by lectin blotting with MAA lectin. An equal concentration of crude protein and an equal volume of MAA-enriched fractions were loaded for MAA lectin blotting. (C) A number of proteins were identified by mass spectrometry analysis of the MAA-enriched fractions from 5B1, 12-273BN, and MeWo cell lines. (D) Gene ontology enrichment analysis (biological processes category) of α-2,3-sialylated proteins common to the three cell lines. Also see table S1. (E) WB analysis with α-TFR1 or α-CD98hc antibodies of MAA pull-down and corresponding input from lysates of 5B1 cells transfected with SCR or ST3GAL1/ST3GAL2 shRNA. The experiment was performed in triplicate; a representative blot is shown. (F) WB analysis of TFR1 and CD98hc in lysates from 5B1 cells transfected with NTC or ST3GAL1 or ST3GAL2 shRNAs. An expanded version of this WB is shown in fig. S10C. (G) Densitometric analysis of TFR1 and CD98hc on lysates from 5B1 cells transfected with SCR or ST3GAL1 or ST3GAL2 shRNAs. The graph is representative of three replicates. Experiments in (B), (E), and (F) were performed in triplicate, and representative images are shown.
Fig. 5.
Fig. 5.. α-2,3-Sialylation of SLC3A2 (CD98hc) is required for its stability and antiproliferative effect.
(A) WB for CD98hc from 5B1 cells transduced with NTC or CD98hc shRNAs. (B) Relative growth curves of 5B1 cells stably transduced with nontargeting control (shSCR) or CD98hc (shA or shB) shRNAs. Data shown are representative of two independent experiments. P values from two-tailed unpaired t tests are shown. (C) WB of CD98hc in 5B1 cells stably overexpressing CD98hc or control vector. A representative image is shown from three biological replicates. (D and E) Cell proliferation assay on 5B1 melanoma cells stably overexpressing CD98hc or empty vector and transduced with nontargeting control shSCR or shST3GAL1 (D) and shSCR or shST3GAL2 (E). The experiment was performed in two biological replicates. (F) WB of CD98hc in 5B1 cells treated with or without STI (200 μM for 96 hours). Densitometric analysis is shown below. (G and H) WB analysis of CD98hc protein in 5B1 cells. STI-treated 5B1 cells were further treated with 10 μM CHX at indicated intervals and analyzed by WB analysis. Densitometric analysis is shown. hrs, hours. WB analysis of SLC3A2 protein in 5B1 cells silenced for ST3GAL1 (I and J) or ST3GAL2 (K and L) and treated with 10 μM CHX at indicated intervals and analyzed by WB analysis. Experiments shown in (G), (I), and (K) were conducted in triplicate. (M) WB analysis of CD98hc protein levels in 5B1 cells treated with 200 μM STI for 96 hours and with 20 μM MG132 for 6 hours, followed by quantitation by densitometry. WB images are representative of three independent experiments. ns, not significant. (N) WB analysis of CD98hc protein in MeWo cells silenced for ST3GAL1 (shA) or ST3GAL2 (shC or shD) and treated with 20 μM MG132 for 6 hours, followed by quantitation. WB images are representative of four independent experiments. P values from paired t tests are shown in (J) and (L) to (N).
Fig. 6.
Fig. 6.. Proposed mechanism by which CD98hc α-2,3-sialylation enhances melanoma cell survival.
A schematic model suggests that α-2,3-sialylation by ST3GAL1 or ST3GAL2 enhances CD98hc stability by protecting it from proteasomal degradation, enhancing melanoma cell survival.

Update of

Similar articles

References

    1. Damsky W. E., Rosenbaum L. E., Bosenberg M., Decoding melanoma metastasis. Cancers (Basel) 3, 126–163 (2010). - PMC - PubMed
    1. Shain A. H., Bastian B. C., From melanocytes to melanomas. Nat. Rev. Cancer 16, 345–358 (2016). - PubMed
    1. Damsky W. E., Bosenberg M., Melanocytic nevi and melanoma: Unraveling a complex relationship. Oncogene 36, 5771–5792 (2017). - PMC - PubMed
    1. Turner N., Ware O., Bosenberg M., Genetics of metastasis: Melanoma and other cancers. Clin. Exp. Metastasis 35, 379–391 (2018). - PubMed
    1. Schadendorf D., van Akkooi A. C. J., Berking C., Griewank K. G., Gutzmer R., Hauschild A., Stang A., Roesch A., Ugurel S., Melanoma. Lancet 392, 971–984 (2018). - PubMed

Substances