. 2025 Jul 4;11(27):eadu3739.
doi: 10.1126/sciadv.adu3739. Epub 2025 Jul 4.

Mitochondrial dysfunction enhances influenza pathogenesis by up-regulating de novo sialic acid biosynthesis

Affiliations

Mitochondrial dysfunction enhances influenza pathogenesis by up-regulating de novo sialic acid biosynthesis

Amanda L Fuchs et al. Sci Adv. .

Abstract

Mitochondrial dysfunction can trigger metabolic adaptations that resemble those induced by influenza A virus (IAV) infection. Here, we show that oxidative phosphorylation (OXPHOS) impairment, modeled by Ndufs4 deficiency, reprograms lung epithelial metabolism to promote IAV pathogenesis. In both Ndufs4 knockout (KO) mice and lung epithelial cells, OXPHOS deficiency increased glycolytic flux, diverting carbons into hexosamine and de novo sialic acid (SIA) biosynthesis pathways. This led to elevated sialylation and enhanced viral attachment. In Ndufs4 KO models, adenosine monophosphate-activated protein kinase signaling was insufficient to blunt this increased metabolic flux. IAV infection further exacerbated this metabolic vulnerability, amplifying SIA and viral burden. Pharmacologic rerouting of glucose carbons with dichloroacetate reduced sialylation, viral replication, and inflammatory responses in Ndufs4 KO models. These findings reveal that mitochondrial dysfunction enhances IAV susceptibility by disrupting energy sensing and fueling viral receptor biosynthesis, highlighting the importance of epithelial metabolism in viral pathogenesis and suggesting metabolic modulation as a potential therapeutic.


Figures

Fig. 1.
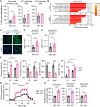
Fig. 1.. Ndufs4 KO mice demonstrate enhanced morbidity with IAV infection.
(A) IAV infection schematic. (B) Body weight and (C) clinical scoring data during IAV infection. Data were analyzed using an ordinary two-way analysis of variance (ANOVA) with Šídák’s multiple comparisons test, n = 12 for WT and n ≥ 13 for KO. (D) Lung IAV NS1 at 1, 4, 7, and 10 dpi, n ≥ 5 for WT and n ≥ 3 for KO. (E) Lung IAV titer FFU/ml data at 4 dpi, n = 4 for WT and KO. (F) Kaplan-Meier survival curve data. Data were analyzed using a Gehan-Breslow-Wilcoxon test, n = 28 for WT and WT +IAV, n = 29 for KO, and n = 15 for KO +IAV. Data in (B) to (F) are presented as means ± SD and were analyzed using unpaired t tests with Welch’s correction, unless otherwise indicated.
Fig. 2.
Fig. 2.. Systemic inflammation is independent of T cell and macrophage Ndufs4 deficiency.
(A) Cytokine levels in lung homogenate samples obtained from WT and KO mice at 4 dpi. Data were analyzed using an unpaired t test, n = 4 for WT and n ≥ 3 for KO. (B) Cytokine levels in peripheral plasma samples obtained from WT and KO mice at 4 dpi, n ≥ 18 for WT and n ≥ 16 for KO. (C) Cytokine levels in peripheral plasma samples obtained from CD4- and LysM-cre KO mice at 4 dpi, n ≥ 7 for CD4-cre KO and n ≥ 9 for LysM-cre KO. (D) Lung IAV NS1 in WT, KO, CD4-cre KO, and LysM-cre KO mice at 4 dpi, n = 7 for WT, n = 10 for KO and LysM-cre KO, and n = 8 for CD4-cre KO. Data in (A) to (D) are presented as means ± SD and were analyzed using unpaired t tests with Welch’s correction, unless otherwise indicated.
Fig. 3.
Fig. 3.. Ndufs4 KO lung epithelium displays impaired bioenergetics and enhanced viral loads.
(A) Complex I activity from WT and KO mice, n = 4 for WT and KO. (B) OXPHOS dependence (%) of bronchial, AT1, and AT2 epithelial cells isolated from UI WT and KO mouse lungs. Data were analyzed using unpaired t tests, n = 3 for WT and KO. (C) BccI RE digest of PCR products amplified from the CRISPR-edited region of genomic DNA revealed genotypes of WT and KO LET1 cells. (D) Near-infrared fluorescent Western blot of ACTB1 and NDUFS4 in WT and KO LET1 cells. (E) Mitochondrial stress test (MST) profile for WT and KO LET1 cells, n = 8 for WT and KO. (F) Mitochondrial function parameters, including basal respiration, maximal respiration, and spare capacity, calculated from MST profiles on WT and KO LET1 cells, n = 8 for WT and KO. Data in (A), (B), (E), and (F) are presented as means ± SD and were analyzed using unpaired t tests with Welch’s correction, unless otherwise indicated. (G) Ridge plots of significant GO pathways positively or negatively enriched through GSEA in IAV-infected KO versus WT mouse lung (left, red) or LET1 cells (right, blue). Representative GO pathways are shown. Color reflects the Benjamini-Hochberg adjusted P value, and x axis reflects the fold change (FC) of genes in the set. (H) Relative X31 viral reads for IAV gene segments HA, matrix (M), nucleoprotein (NP), nonstructural (NS), acidic polymerase (PA), basic polymerases 1 and 2 (PB1 and PB2, respectively), and NA between IAV-infected KO and WT mouse lung (red, top), and LET1 cells (blue, bottom).
Fig. 4.
Fig. 4.. Metabolic reprogramming in Ndufs4 KO enhances glycolysis.
(A) Glycolytic dependence (%) of bronchial, AT1, and AT2 epithelial cells isolated from UI WT and KO mouse lungs. Data were analyzed using unpaired t tests, n = 3 for WT and KO. (B) Metabolic pathway enrichment analysis of untargeted metabolomics data from UI and IAV-infected KO versus WT LET1 cells, n = 6 for UI WT, UI KO, WT +IAV, and KO +IAV. (C) Confocal microscopy imaging and quantitation of GLUT1 nMFI in (D) UI and (E) IAV-infected WT and KO LET1 cells. Scale bars, 20 μm; n = 8 for UI WT and KO +IAV, n = 10 for UI KO, and n = 7 for WT +IAV. (F) Uniform 13C-glucose isotope labeling of metabolic intermediates in UI and IAV-infected WT and KO LET1 cells. Data were analyzed using an ordinary two-way ANOVA with uncorrected Fisher’s least significant difference (LSD) test, n = 3 for UI WT and UI KO, n = 4 for WT +IAV and KO +IAV. (G) Glycolysis stress test (GST) profile for WT and Ndufs4 KO LET1 cells, n = 8 for WT and KO. (H) Glycolytic function parameters, including glycolysis, glycolytic capacity, and glycolytic reserve, calculated from GST profiles on WT and KO LET1 cells, n = 8 for WT and KO. Data in (A) and (D) to (H) are presented as means ± SD and were analyzed using unpaired t tests with Welch’s correction, unless otherwise indicated.
Fig. 5.
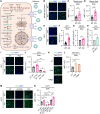
Fig. 5.. Complex I deficiency and mitochondrial dysfunction enhances SIA expression through impaired AMPK regulation.
(A) Illustration of glycolytic link into the hexosamine pathway, SIA biosynthesis, and influenza attachment via SIA-glycans. (B) Confocal microscopy imaging and quantitation of (C) MAA and (D) SNA nMFI in UI WT and KO mouse lung tissue, n ≥ 10 for WT and n ≥ 11 for KO. (E) Confocal microscopy imaging and quantitation of (F) SNA nMFI in UI WT and KO LET1 cells, n = 17 for WT and n = 16 for KO. (G) Flow cytometry analysis of MAA lectin staining nuMFI ratios (KO:WT) in WT and KO MDCK cells, n = 6 for WT and KO. (H) Flow cytometry analysis of MAA lectin staining nuMFI ratios (MT-ND1:HD) in HD and MT-ND1 pathogenic variant LCL cells, n = 3 for HD and MT-ND1. (I) Confocal microscopy imaging and quantitation of (J) SNA nMFI in UT and 3 μM azaserine-treated (+Aza) WT and KO LET1 cells, n = 3 for UT WT, UT KO, WT +Aza, and KO +Aza. (K) Confocal microscopy imaging and quantitation of (L) SNA nMFI in UT, 0.05 μM rotenone-treated (+Rot), and 0.1 μM oligomycin-treated (+Oligo) WT LET1 cells, n = 3 for UT, +Rot, and +Oligo. (M) Confocal microscopy imaging and quantitation of (N) SNA nMFI in UT, 0.25 mM AICAR-treated (+AICAR), and 1 μM CC-treated (+CC) WT and KO LET1 cells, n = 3 for UT WT, UT KO, WT +AICAR, KO +AICAR, WT +CC, and KO +CC. Scale bars in (B), (E), (I), (K), and (M), 20 μm. Data in (C), (D), (F) to (H), (J), (L), and (N) are presented as means ± SD and were analyzed using unpaired t tests with Welch’s correction, unless otherwise indicated.
Fig. 6.
Fig. 6.. Enhanced SIA during IAV infection in Ndufs4 KO mediates increased viral attachment.
(A) Confocal imaging and quantitation of (B) SNA and (C) PNA nMFI in UI and IAV-infected WT and KO mouse lung tissue. Data were analyzed using ordinary two-way ANOVAs with uncorrected Fisher’s LSD multiple comparisons tests, n = 3 for UI WT, UI KO, +IAV WT, and +IAV KO. (D) Confocal microscopy imaging and quantitation of (E) SNA and (F) PNA nMFI in UI and IAV-infected WT and KO LET1 cells. Data were analyzed using ordinary two-way ANOVAs with uncorrected Fisher’s LSD multiple comparisons tests, n ≥ 10 for UI WT, n ≥ 11 for UI KO, n ≥ 12 for +IAV WT, and n ≥ 16 for +IAV KO. (G) Lung IAV NS1 in WT and KO LET1 cells at 24 hpi, n = 3 for WT and KO. (H) IAV attachment NS1 in WT and KO LET1 cells at 20 mpi, n = 4 for WT and KO. (I) Confocal imaging and quantitation of (J) HA nMFI in WT and KO LET1 cells at 20 mpi. Data were analyzed using an unpaired t test, n = 3 for WT and KO. (K) Confocal microscopy imaging and quantitation of (L) SNA and (M) HA nMFI in UT and SIATI-treated IAV-infected KO LET1 cells. Data were analyzed using unpaired t tests, n = 3 for UT and +SIATI. Scale bars in (A), (D), (I), and (K), 20 μm. Data in (B), (C), (E) to (H), (J), (L), and (M) are presented as means ± SD and were analyzed using unpaired t tests with Welch’s correction, unless otherwise indicated.
Fig. 7.
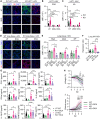
Fig. 7.. Targeting glycolysis reduces SIA and abrogates viral infection in Ndufs4 KO mice.
(A) Confocal microscopy imaging and quantitation of (B) SNA and (C) HA nMFI in UT, 2DG-treated, and DCA-treated IAV-infected WT and KO LET1 cells, n = 13 for UT WT, n ≥ 16 for UT KO, n = 16 for WT +2DG, n ≥ 18 for KO +2DG, n = 10 for WT +DCA, and n ≥ 13 for KO +DCA. (D) Confocal imaging and quantitation of (E) SNA, MAA, and NP nMFI in UT and DCA-treated IAV-infected WT and KO mouse lung tissue, n = 3 for UT WT, WT +DCA, KO +DCA, and n ≥ 3 for UT KO. (F) Lung IAV NS1 in UT WT, DCA-treated WT, UT KO, and DCA-treated KO mice at 4 dpi. Data were analyzed using a Brown-Forsythe and Welch ANOVA test with Dunnett’s T3 multiple comparisons test, n = 7 for WT, n = 10 for WT +DCA and KO, and n = 13 for KO +DCA. (G) Plasma cytokine levels in UT WT, DCA-treated WT, UT KO, and DCA-treated KO mice at 4 dpi. Data were analyzed using unpaired t tests with Welch’s correction, n ≥ 18 for WT, n = 9 for WT +DCA, n ≥ 16 for KO, and n ≥ 11 for KO +DCA. DCA treatment of KO mice improves (H) body weight and (I) clinical scoring data during IAV infection, n = 12 for WT, n = 10 for WT +DCA and KO +DCA, and n ≥ 13 for KO. Scale bars in (A) and (D), 20 μm. Data in (B), (C), and (E) to (I) are presented as means ± SD and were analyzed using an ordinary two-way ANOVA with Tukey’s multiple comparisons test, unless otherwise indicated.

References

    1. Fisher A. B., Intermediary metabolism of the lung. Environ. Health Perspect. 55, 149–158 (1984). - PMC - PubMed
    1. Hoffmann R. F., Jonker M. R., Brandenburg S. M., de Bruin H. G., Ten Hacken N. H. T., van Oosterhout A. J. M., Heijink I. H., Mitochondrial dysfunction increases pro-inflammatory cytokine production and impairs repair and corticosteroid responsiveness in lung epithelium. Sci. Rep. 9, 15047 (2019). - PMC - PubMed
    1. Katzen J., Beers M. F., Contributions of alveolar epithelial cell quality control to pulmonary fibrosis. J. Clin. Invest. 130, 5088–5099 (2020). - PMC - PubMed
    1. Garcia S., Saldana-Caboverde A., Anwar M., Raval A. P., Nissanka N., Pinto M., Moraes C. T., Diaz F., Enhanced glycolysis and GSK3 inactivation promote brain metabolic adaptations following neuronal mitochondrial stress. Hum. Mol. Genet. 31, 692–704 (2022). - PMC - PubMed
    1. Ren L., Zhang W., Zhang J., Zhang J., Zhang H., Zhu Y., Meng X., Yi Z., Wang R., Influenza A virus (H1N1) infection induces glycolysis to facilitate viral replication. Virol. Sin. 36, 1532–1542 (2021). - PMC - PubMed

MeSH terms

Substances