. 2025 Jul 4;11(27):eadu1521.
doi: 10.1126/sciadv.adu1521. Epub 2025 Jul 4.

Multiomic integration reveals subtype-specific predictors of neoadjuvant treatment response in breast cancer

Affiliations

Multiomic integration reveals subtype-specific predictors of neoadjuvant treatment response in breast cancer

Zongchao Mo et al. Sci Adv. .

Abstract

Neoadjuvant therapy has been widely used in breast cancer, but treatment response varies among individuals. We conducted multiomic profiling on tumor samples from 149 Chinese patients with breast cancer across ER-HER2+, ER+HER2+, and ER-HER2- subtypes, categorizing outcomes as pathologic complete response (pCR; n = 81) or residual disease (RD; n = 68). We identified distinct molecular features linked to pCR in each subtype: elevated cell proliferation in patients with ER-HER2- pCR, higher CDKN2A methylation in patients with ER-HER2- RD, increased KIT methylation in patients with ER-HER2+ RD, and MAP4K1 hypermethylation in patients with ER+HER2+ RD. These findings were subsequently validated in independent datasets. By integrating clinical and multiomic data, we developed MOPCR, a subtype-specific machine learning model that outperformed single-omic approaches in predicting treatment response. MOPCR demonstrated potential generalizability across cohorts and provided preliminary stratification of patient subgroups with higher pCR probability, offering valuable insights for precision cancer management.


Figures
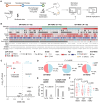
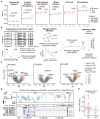
Fig. 1.
Fig. 1.. Summary of the cohort and clinical features associated with response to NACT.
(A) Design of this study. Biopsy samples for multiomic data were collected at diagnosis, with treatments administered before surgery. Pathologic examination classified patients into pCR and RD groups. Biomarkers were identified by comparing these groups across different omic data and integrated using machine learning models to predict treatment outcomes. (B) Summary of clinical information and availability of four omic data types used in this study. T, tumor size; N, lymph node metastasis; grade, histological grade; chemo, the combination of chemotherapy; T, docetaxel; Cb, carboplatin; EC, epirubicin plus cyclophosphamide; Y, pyrotinib; anti-HER2. anti-HER2 treatment. (C) Multivariate analysis results by logistic regression, highlighting clinical features with significant independent association with NACT outcome (P < 0.1). (D and E) Association between pCR and subtypes (D), clinical tumor grade (E), and lymph node metastasis status (E) at diagnosis. P values were calculated by the chi-square test (D) and Fisher’s exact test (E). (F) Association between pCR and Ki67 index among subtypes. P values were calculated by Wilcoxon rank sum tests.
Fig. 2.
Fig. 2.. Somatic mutation signature and landscape.
(A) Somatic mutation landscape in pCR and RD groups, respectively. Only 94 samples with available purity by FACETS were shown. (B) Absolute and relative SNV signature distribution in 94 patients. Patients were clustered on the basis of the relative signature contribution. (C and D) Focal amplification and focal deletion comparison between pCR and RD groups in the ERHER2 subtype. (E) Log2 ratio of cytoband 6q27 in the ERHER2 subtype.
Fig. 3.
Fig. 3.. Methylation features as predictors for pCR.
(A) Mean methylation levels in cis-regulatory elements for pCR and RD in each subtype. P values were obtained by comparing pCR versus RD and among subtypes; only P < 0.1 is shown. DNase, deoxyribonuclease. (B) Framework for identifying methylation biomarkers. Genome-wide CpG methylation was segmented into regions, and differential methylation regions (DMRs) were identified using rank sum tests. A representative region was selected for each gene to represent the gene by considering methylation differences (pCR versus RD) and associations with RNA expression. Comparison of representative regions helps identify the differentially methylated genes (DMGs). Genes from the BRCANET list were prioritized. DMRs within the DMGs are prioritized as biomarkers for downstream analysis (C) DMGs for pCR versus RD in each subtype (P < 0.05). BRCANET genes are outlined in black. ∆β indicates mean methylation differences; larger points reflect more significant associations with gene expression. (D) CpG-level methylation for CDKN2A in ERHER2 (pCR versus RD). Top: Mean β values for each CpG site; dashed lines mark ±1000 bp from the transcription start site (TSS). The second panel: Top two DMRs identified through segmentation. The third panel: Rank sum test P values for CpG sites (P < 0.05); larger points indicate greater significance. RefSeq transcripts are shown at the bottom, with red arrows marking the gene start and end. (E) The distribution of methylation level at chr9: 21,996,194 by pyrosequencing in the independent ERHER2 validation cohort. P value was calculated by the Wilcoxon rank sum test.
Fig. 4.
Fig. 4.. Transcriptomic features associated with NACT outcome.
(A) t-SNE analysis of gene expression. Points are colored by molecular subtypes, with solid points indicating pCR and hollow points representing RD. (B) Analysis of variance (ANOVA)–based clustering of gene expression. The top 100 subtype-associated genes (ANOVA) were used for clustering, with rows showing functional annotations of enriched gene clusters. (C) Differentially expressed genes between pCR and RD in each subtype (DESeq2, P < 0.05). BRCANET genes are highlighted with black borders. Dot size represents P values; FC indicates fold change. (D) Gene set enrichment analysis (GSEA) on the hallmark pathway for each subtype. Pathways were clustered by −log10 (adjusted P value). Dot size indicates significance; red denotes pCR enrichment, and blue denotes RD enrichment. Subtypes: −/− (ERHER2), −/+ (ERHER2+), and +/+ (ER+HER2+). NES, normalized enrichment score.
Fig. 5.
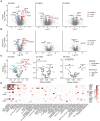
Fig. 5.. Proteomic features associated with NACT outcome.
(A and B) Differentially expressed proteins (A) and phosphoproteins (B) between pCR and RD in each subtype. P values were calculated using the Wilcoxon rank sum test. Significantly differentially expressed proteins and phosphoproteins (P < 0.05) within BRCANET are outlined in black. Dot size represents P values. FC, fold change. (C) Proteins and phosphoprotein pathway differences between pCR and RD. Pathway activity was assessed using protein and phosphoprotein abundance based on the ssGSEA method. Only significant pathways are shown for the ERHER2 subtype, while the top five pathways are displayed for HER+ subtypes. P value was calculated using the Wilcoxon rank sum test. (D) Hallmark pathway enrichment analysis of differentially expressed genes in single-omic data (Meth., methylation; RNA, transcription; Pro., protein; Pho., phosphoprotein) and multiomic data between pCR and RD in each subtype using the multiomic integration method. P values less than 1 × 10⁻⁴ are labeled as 1 × 10⁻⁴, with significant results (P < 0.05) marked by the asterisk (*). UV, ultraviolet.
Fig. 6.
Fig. 6.. Machine learning predictor of clinical outcome.
(A) Framework for training and validating the machine learning model. External datasets with missing omic features were imputed using multiomic data from this study before independent validation. (B) Cross-validation performance (accuracy) comparison between single-omic models and multiomic pCR prediction models (MOPCR) across three subtypes. P values (Wilcoxon rank sum tests) compare MOPCR to aggregated results from other methods. (Clin., clinical features; Meth., methylation; RNA, gene expression; Prot., protein expression; Pho., phosphoprotein expression; MOPCR, multiomic model with feature selection.) The mean accuracy for each model was labeled. (C) SHapley Additive exPlanations (SHAP) values for features in the optimized MOPCR model. The dot color represents the feature value. (Lymph, lymph node metastasis; grade 3, tumor grade 3 at diagnosis; tumor size, T3/T4 at diagnosis; Path., pathologic; Meth., methylation; RNA, gene expression; Prot., protein expression; Pho., phosphoprotein expression.) EMT, EPITHELIAL_MESENCHYMAL_TRANSITION. (D) Receiver operating characteristic curves for independent validation in external datasets for each subtype (15, 45, 46). AUC values are shown in parentheses for each cohort. [FPR, false-positive rate; TPR, true-positive rate; Sammut Dis, discovery dataset from the TransNEO cohort (15); Sammut Val, validation dataset from the TransNEO cohort (15). Only cohorts with >10 cases were included.] (E) Summary, vision, and perspectives of the machine learning predictors in this study.

References

    1. Lei S., Zheng R., Zhang S., Wang S., Chen R., Sun K., Zeng H., Zhou J., Wei W., Global patterns of breast cancer incidence and mortality: A population-based cancer registry data analysis from 2000 to 2020. Cancer Commun. 41, 1183–1194 (2021). - PMC - PubMed
    1. Fan L., Strasser-Weippl K., Li J.-J., St Louis J., Finkelstein D. M., Yu K.-D., Chen W.-Q., Shao Z.-M., Goss P. E., Breast cancer in China. Lancet Oncol. 15, e279–e289 (2014). - PubMed
    1. Xu X., Zhao W., Liu C., Gao Y., Chen D., Wu M., Li C., Wang X., Song X., Yu J., Liu Z., Yu Z., The residual cancer burden index as a valid prognostic indicator in breast cancer after neoadjuvant chemotherapy. BMC Cancer 24, 13 (2024). - PMC - PubMed
    1. von Minckwitz G., Huang C.-S., Mano M. S., Loibl S., Mamounas E. P., Untch M., Wolmark N., Rastogi P., Schneeweiss A., Redondo A., Fischer H. H., Jacot W., Conlin A. K., Arce-Salinas C., Wapnir I. L., Jackisch C., DiGiovanna M. P., Fasching P. A., Crown J. P., Wülfing P., Shao Z., Caremoli E. R., Wu H., Lam L. H., Tesarowski D., Smitt M., Douthwaite H., Singel S. M., Geyer C. E. Jr., KATHERINE Investigators , Trastuzumab emtansine for residual invasive HER2-positive breast cancer. N. Engl. J. Med. 380, 617–628 (2019). - PubMed
    1. Spring L. M., Fell G., Arfe A., Sharma C., Greenup R., Reynolds K. L., Smith B. L., Alexander B., Moy B., Isakoff S. J., Parmigiani G., Trippa L., Bardia A., Pathologic complete response after neoadjuvant chemotherapy and impact on breast cancer recurrence and survival: A comprehensive meta-analysis. Clin. Cancer Res. 26, 2838–2848 (2020). - PMC - PubMed

MeSH terms