. 2025 Jul 4;11(27):eadv1015.
doi: 10.1126/sciadv.adv1015. Epub 2025 Jul 4.

CryoRhodopsins: A comprehensive characterization of a group of microbial rhodopsins from cold environments

Affiliations

CryoRhodopsins: A comprehensive characterization of a group of microbial rhodopsins from cold environments

Gerrit H U Lamm et al. Sci Adv. .

Abstract

Microbial rhodopsins are omnipresent on Earth; however, the vast majority of them remain uncharacterized. Here, we describe a rhodopsin group found in microorganisms from cold environments, such as glaciers, denoted as CryoRhodopsins (CryoRs). A distinguishing feature of the group is the presence of a buried arginine residue close to the cytoplasmic face. Combining single-particle cryo-electron microscopy and x-ray crystallography with rhodopsin activation by light, we demonstrate that the arginine stabilizes an ultraviolet (UV)-absorbing intermediate of an extremely slow CryoRhodopsin photocycle. Together with extensive spectroscopic characterization, our investigations on CryoR1 and CryoR2 proteins reveal mechanisms of photoswitching in the identified group. Our data suggest that CryoRs are sensors for UV irradiation and are also capable of inward proton translocation modulated by UV light.


Figures
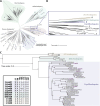
Fig. 1.
Fig. 1.. Phylogeny of CryoRs.
(A) Maximum likelihood phylogenetic tree of MRs. The tree includes 2199 sequences reported in (1), 3 sequences of DSE rhodopsins reported in (17), and 40 sequences of CryoRs found in the present work. (B) Enlarged view of the tree branch containing CryoRs. Amino acid residues in helix B at the position corresponding to that of T46 in BR are shown at the tips. (C) Rectangular representation of the phylogenetic tree of the CryoRs and nearby DSE and ACI rhodopsins clades. The inset in the left bottom corner shows amino acids of the seven-letter motifs of CryoR1-5, DSE, and ACI rhodopsins (numbering corresponds to CryoR1). The unique arginine (R57 in CryoR1) is boxed for clarity.
Fig. 2.
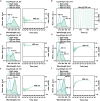
Fig. 2.. Illumination experiments and M state kinetics of CryoRs.
(A and C to F) Dark-state spectra (light green), as well as the PSS spectra after illumination of the main absorption band (blue), the spectra after illumination of the obtained PSS with blue light (dark green) to recover the dark state of each investigated CryoR at pH 8.0. Each LED was turned on for 100 s. The respective output powers are provided in Materials and Methods. In addition, the flash photolysis transient at 400 nm is shown for each protein to elucidate the unusually slow kinetics of the M intermediate and the whole photocycle. (B) Illumination experiments of CryoR1 at pH 10.5 including an alternating illumination scheme of green and blue-light to test for potential photobleaching and photofatigue. a.u., arbitrary units; RT, room temperature; mOD, milli optical density; abs., absorbance.
Fig. 3.
Fig. 3.. Spectroscopic characterization of CryoR1.
(A) Femtosecond TA measurement of CryoR1 at pH 10.5, shown as difference absorption spectra at specific time points after excitation. (B) Flash photolysis measurement of CryoR1 at pH 10.5 shown as difference absorption spectra at specific time points after excitation. Dashed boxes illustrate differences between M1 and M2. The photocycle was quenched after 5 s via illumination with a 405-nm LED (8.71 mW) before each acquisition. (C) Photocycle model for CryoR1 at pH 10.5. (D) Femtosecond transient absorption (TA) measurement of CryoR1 at pH 3.5 presented similarly as in (A). (E) Transient spectrum taken from the femtosecond TA measurement shown in (D), showing the small amplitude for K and GSB once the photocycle is entered. Amplitudes at ~620 nm are reasoned by scattering of the excitation beam. (F) Transients at two wavelengths (473 and 530 nm) taken from an femtosecond TA measurement at pH 3.5 performed with a linear timescale ending at 3 ps and a decreased linear step size compared to the measurement shown in (D). The raw data are displayed as dots and the obtained fit as lines to illustrate the observed coherent oscillations. Furthermore, the residuals of the raw data and the fit are shown. The region of interest is highlighted with the dashed box. (G) pH titration of the CryoR1 dark-state absorption spectrum from pH 2.5 to 11.0. Spectra are normalized with respect to the absorption band at 280 nm. (H) Dark-state absorption spectra of CryoR1 WT, D237N, E102Q, and E102Q/D237N mutants. (I) Illumination experiments of CryoR1 performed at pH 3.5. The dark state was first illuminated with a 625-nm LED to check for a potential M state formation and with a 420-nm LED afterward to check for a potential BLQ effect.
Fig. 4.
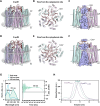
Fig. 4.. Pentameric architecture of CryoRs and unusual central channel.
(A) Overall view of the CryoR1 pentamer in detergent micelles and nanodiscs. (B) View at the CryoR1 pentamer from the cytoplasmic side. (C) Side view of the central channel in CryoR1. (D) Overall view of the CryoR2 pentamer in crystals. (E) View at the CryoR1 pentamer from the cytoplasmic side. (F) Side view of the central channel in CryoR1. C terminus is colored dark red. (G) Spectroscopy of CryoR11–263. Left: The dark-state spectra (light green), as well as the PSS spectra after illumination of the main absorption band (blue), the spectra after illumination of the obtained PSS with blue light (dark green) to recover the dark state of CryoR11–263 at pH 8.0. The 565-nm LED was turned on for 100 s (1.05 mW), while the 420-nm LED turned on for 100 s (0.19 mW). Right: The flash photolysis transient at 400 nm. (H) Size exclusion chromatography (SEC) profiles of pentameric CryoR1WT [molecular weight (MW): 180.6 kDa] and CryoR11–263 (MW: 147.2 kDa). SEC profile of the pentameric light-driven sodium pump ErNaR (MW: 164.0 kDa) measured under the same conditions using the same column is shown as a reference. CP, cytoplasmic side; EC, extracellular side.
Fig. 5.
Fig. 5.. Structural features of the CryoR protomer.
(A) Side view (left) and view from the cytoplasmic side (right) of the CryoR1 pentamer and the interprotomeric cavity (shown with light blue surface). (B) Detailed view of the interprotomeric cavity and the internal cytoplasmic cavity in CryoR1. (C) Side view (top) and view from the extracellular side (bottom) of the protomer of CryoR1. N terminus is colored wheat. The small α helix in the N terminus is shown as a cylinder. Internal cavities are colored light pink. For the representation, the cryo-EM structure of CryoR1 at pH 8.0 was used. The structural date has been obtained at 80 K. (D) Sequence alignment of the N-terminal region of representative CryoRs and DSE rhodopsins. (E) Alignment of the amino acids surrounding the extracellular cavity of representative CryoRs and DSE rhodopsins.
Fig. 6.
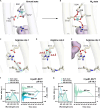
Fig. 6.. Cryo-EM structures of the ground and M2 states of CryoR1.
(A) Preillumination of the sample solution with 405- and 530-nm LEDs for the ground (top) and M2 (bottom) states, respectively. The insets show the sample before and after illumination. Spectra correspond to the illuminated samples. (B) Scheme of the cryo-EM grid preparation. For the ground state, the grid was prepared under the 405-nm LED light (top). For the M2 state, the grid was prepared under the 530-nm LED and 532-nm continuous wave (cw) laser light (bottom). (C) Cryo-EM maps of the ground (top) and M2 (bottom) states of CryoR1. (D) Cryo-EM maps near the retinal and R57 in the ground (top) and M2 (bottom) states. The R57 rearrangement is indicated with a red arrow. (E) Distortion of helix G in the M2 state (light yellow) compared to the ground state (light purple). Maximum displacement is indicated with a red arrow. (F) Overall alignment of the CryoR1 protomer in the ground (light purple) and M2 (light yellow) states. (G) Detailed view of the rearrangements of R57 and residues in helices F and G between the ground (light purple) and M2 (light yellow) states. The major changes are indicated with red arrows.
Fig. 7.
Fig. 7.. Electrophysiological characterization of CryoR1 in NG108-15 cells.
(A) Voltage dependence of CryoR1 photocurrents elicited by nanosecond laser pulses with a wavelength of 565 nm. (B) Stationary CryoR1 photocurrents upon illumination with white light. (C to E) CryoR1 photocurrents at the shown voltages elicited by nanosecond laser pulses with wavelengths of (C) 500 nm for the activation of the ground-state subpopulation with the deprotonated counterion complex, (D) 620 nm for the activation of the ground-state subpopulation with the protonated counterion complex, and (E) 420 nm for M2 state activation. div., division
Fig. 8.
Fig. 8.. Determinants of the dominant M state in the CryoR photocycle.
(A) The RSB region in the ground state of CryoR1 at pH 10.5. The proton at the RSB is indicated with a cyan circle. The tentative proton relocation with the rise of the M state is indicated with a cyan arrow. (B) The RSB region in the M state of CryoR1 at pH 10.5. The proton relocated to the E102-D237 complex is shown with a cyan circle. The blocked transfer pathways of the proton to the RSB and toward the extracellular side are indicated with red arrows and crosses. (C) R57 effect on the pKa of the RSB in the M state of CryoR1 (region of the effect highlighted cyan). (D) R57 effect on the pKa of E113 in the M state of CryoR1 (region of the effect highlighted cyan). (E) R57 blocks the pathway for protons from the cytoplasm to the RSB. The cytoplasmic cavity is shown with a pink surface. (F) Spectroscopy of CryoR1R57T at pH 8.0. Left: The dark-state spectrum (light green), as well as the PSS spectrum after illumination of the main absorption band (blue) and the spectrum after illumination of the obtained PSS with blue light (dark green) to recover the dark state. Right: The flash photolysis transients at 400, 550, and 600 nm. (G) Spectroscopy of CryoR1R57T at pH 10.5. Left: The dark-state spectrum (light green), as well as the PSS spectrum after illumination of the main absorption band (blue) and the spectrum after illumination of the obtained PSS with blue light (dark green) to recover the dark state. Right: The flash photolysis transient at 400 nm. The 565-nm LED was turned on for 100 s (1.05 mW), while the 420-nm LED was turned on for 100 s (0.19 mW).
Fig. 9.
Fig. 9.. Putative cytoplasmic transducers of CryoRs.
(A) Alignment of contigs containing the CryoR gene in bacteria available in GenBank. The accompanying putatively cotranscribed CDS is colored in blue. For Herbiconiux daphne (H. daphne) strain information was not provided. (B) AF3 prediction of the CryoR1/putative transducer complex (left) and pentamer of putative transducer alone (right) from Glacihabitans sp. INWT7. Models are colored according to predicted local distance difference test (plDDT) score. (C) ipTM scores for predictions of different oligomeric states of putative transducer from Glacihabitans sp. INWT7. Prediction of pentameric assembly has the highest ipTM score of 0.9. (D) ipTM scores of the structures of CryoR/putative transducer complexes from (A). Gray area indicates the ipTM region of 0.6 to 0.8, where the solutions could be correct or wrong. For each complex, 10 predictions with different seeds have been calculated. (E) Detailed view of the C terminus of CryoR (dark red) interaction with the putative transducer (cyan). (F) View on the predicted putative transducer from the cytoplasmic side (left) and rotated by 180° (right). (G) Similar β strands arrangements in the pentamer of bacterial pleckstrin homology (PH) domain (64) [Protein Data Bank (PDB) ID: 3DCX]. (H) β Sheet (β blade) of the putative transducer formed by two adjacent protomers (purple and pink) and C terminus of CryoR (dark red). (I) β Sheet (β blade) of the bacterial PH domain (PDB ID: 3DCX) formed by two adjacent protomers (purple and pink).

Similar articles

References

    1. Bulzu P.-A., Kavagutti V. S., Andrei A.-S., Ghai R., The evolutionary kaleidoscope of rhodopsins. mSystems 7, e0040522 (2022). - PMC - PubMed
    1. Govorunova E. G., Sineshchekov O. A., Li H., Spudich J. L., Microbial rhodopsins: Diversity, mechanisms, and optogenetic Applications. Annu. Rev. Biochem. 86, 845–872 (2017). - PMC - PubMed
    1. Béjà O., Aravind L., Koonin E. V., Suzuki M. T., Hadd A., Nguyen L. P., Jovanovich S. B., Gates C. M., Feldman R. A., Spudich J. L., Spudich E. N., DeLong E. F., Bacterial rhodopsin: Evidence for a new type of phototrophy in the sea. Science 289, 1902–1906 (2000). - PubMed
    1. Pushkarev A., Inoue K., Larom S., Flores-Uribe J., Singh M., Konno M., Tomida S., Ito S., Nakamura R., Tsunoda S. P., Philosof A., Sharon I., Yutin N., Koonin E. V., Kandori H., Béjà O., A distinct abundant group of microbial rhodopsins discovered using functional metagenomics. Nature 558, 595–599 (2018). - PMC - PubMed
    1. Boyden E. S., Zhang F., Bamberg E., Nagel G., Deisseroth K., Millisecond-timescale, genetically targeted optical control of neural activity. Nat. Neurosci. 8, 1263–1268 (2005). - PubMed

LinkOut - more resources