. 2025 Jul 4;11(27):eadu2339.
doi: 10.1126/sciadv.adu2339. Epub 2025 Jul 4.

TP53 missense-specific transcriptional plasticity drives resistance against cell cycle inhibitors in pancreatic cancer

Affiliations

TP53 missense-specific transcriptional plasticity drives resistance against cell cycle inhibitors in pancreatic cancer

Laura Urbach et al. Sci Adv. .

Abstract

In ~70% of patients with pancreatic ductal adenocarcinoma, the TP53 gene acquires gain-of-function (GOF) mutations leading to rapid disease progression. Specifically, missense p53 (misp53) GOF mutations associate with therapy resistance and worse clinical outcomes. However, the molecular functions of distinct misp53 mutants in plasticity and therapy response remain unclear. Integrating multicenter patient data and multi-omics, we report that the misp53R273H/C mutant is associated with cell cycle progression and a basal-like state compared to the misp53R248W/Q mutant. Loss of misp53R273H/C decreased tumor growth and liver metastasis while prolonging survival in preclinical models. We found that misp53R273H/C specifically regulated the Rb/DREAM axis involved in cell cycle regulation. Notably, a clinical CDK4/6 inhibitor reduced misp53R273H/C mutant expression. However, it triggered MAPK/ERK-mediated resistance mechanisms, enhancing cell survival and resistance to CDK4/6 inhibitors. Combining MAPK/ERK and CDK4/6 inhibitors reduced misp53R273H/C-associated oncogenic functions. Thus, distinct misp53 mutants show unique cell-intrinsic plasticity, therapeutic vulnerabilities, and resistance mechanisms.


Figures

Fig. 1.
Fig. 1.. TP53 hotspot missense mutations are associated with distinct transcriptional programs.
(A) cBioPortal (23) mutational profile of the TP53 gene locus in the TCGA (28), ICGC (29), and QCMG (9) PDAC patient cohorts (total patients, n = 739; TP53-mutated patients, n = 396). Red circles indicate hotspot TP53 missense mutations (misp53). (B) Hotspot misp53 analysis of the KFO5002 and MolPac internal PDAC cohorts of the UMG Göttingen (UMG) (total patients, n = 76). (C and D) Knockdown of TP53 transcript from the misp53R273H silencing (sip53R273H, red) versus control siRNA (siCtrl, gray) RNA-seq in PANC1 (C) and the misp53R248W silencing (sip53R248W, red) versus control siRNA (siCtrl, gray) RNA-seq in MiaPaCa2 (D). Normalized counts with means ± SD shown. n = 3 per condition. (E and F) GSEA analysis for MSigDB Hallmark gene sets with q value <0.05 in the differentially expressed genes of the sip53R248W versus siCtrl RNA-seq in MiaPaCa2 (E) and the sip53R273H versus siCtrl RNA-seq in PANC1 (F). Highlighted gene sets are associated to the cell cycle (F). n = 3 per condition. (G and H) GSEA plots for cell cycle–related MSigDB curated (C2) gene sets (G) and BL aggressiveness–related MSigDB curated (C2) gene sets (H) of the sip53R273H versus siCtrl RNA-seq in PANC1. Normalized enrichment score (NES) and false discovery rate (FDR) q-value are indicated.
Fig. 2.
Fig. 2.. The genome-wide binding of misp53R273H is associated with E2F cell cycle signatures.
(A to D) Genomic annotation of misp53R273H-specific (A) and misp53R248W-specific (B) binding sites, determined by peak overlap of misp53R273H and misp53R248W ChIP-seqs in PANC1 and MiaPaCa2, respectively. The coverage of misp53R273H- and misp53R248W-specific ChIP-seq peaks over TSS is shown in (C). The motif enrichment analysis of misp53R273H- and misp53R248W-specific ChIP-seq peaks is shown in (D) with motif sequences displayed and −log10(adjusted P values) indicated as a heatmap. n = 1. (E to J) GSVA scores of publicly available RNA-seq data from 265 patients of the TCGA (28) and QCMG (9) PDAC patient cohorts for MSigDB Hallmark gene sets E2F targets (E), G2-M checkpoint (F), and mitotic spindle (G), and curated (C2) gene sets “Reactome: M phase” (H), “Reactome: S phase” (I), and “Fischer: G2-M cell cycle” (J). Patients were stratified according to their TP53 mutational status: wildtype “WT,” all mutations/deletions except codons R248 and R273 “other alterations,” hotspot missense mutations at codon R248 “R248” and R273 “R273.” Values are displayed in boxplots indicating median, quartiles, and min/max values, and each dot represents the GSVA score of one patient. The P values are indicated and determined by Student’s t-test with Welch’s correction.
Fig. 3.
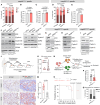
Fig. 3.. Loss of misp53R273H/C leads to cell cycle arrest.
(A and D) Cell cycle analysis of PANC1 and MiaPaCa2 cells after p53 silencing compared to control and untreated samples. P values and the percentage of single cells with means ± SD are shown (n = 3). (B, C, and E) Analysis of G1 phase after silencing misp53R273C or misp53R248Q (in red) compared to control siRNA (gray) in PDX cell lines [n = 4 for (B) and (C); n = 2 for (E)]. P values and relative number of single cells in G1 phase with means ± SD are shown. (F) Immunoblot for cyclins, CDKs, and p53 after silencing p53 versus control (n = 3). (G to I) Immunoblot analysis in the indicated PDX cells for p53, cyclin A/E, and β-actin (“Actin”) after p53 silencing [n = 3 for (G) and (H); n = 2 for (I)]. (J) Mice were subcutaneously implanted with primary PDAC tumors with either misp53R273H/C or misp53R248Q/W mutations. (K) Analysis of tumor growth rate of (J) is shown in violin plots. Each dot represents the number of days until the tumor achieved a diameter of 1 cm, with R273H/C tumors (n = 2) and R248Q/W tumors (n = 4). (L) Ki67 staining of tumors of (J), with Ki67+ (red) and Ki67 (blue) cell detection shown (scale bar, = 200 μm). (M) Quantification of (L) for percentages of Ki67+ cells per field of view (F.o.V.). Each dot represents one F.o.V., with n = 2 per condition. (N) Mice received orthotopic transplants of PANC1 or MiaPaCa2 cells with stable knockdown of TP53 (shTP53R273H and shTP53R248W, respectively), or empty vector (EV) control. (O) Kaplan-Meier analysis of the PANC1 cohort indicates median survival, assessed using the log-rank test. (P) Pancreas weight measurements in PANC1 cohort (n = 10 for EV; n = 11 for shTP53R273H). (Q) Macroscopic analysis of liver metastasis for PANC1 EV and shTP53R273H. (A) to (E), (K), (M), and (P) used Student’s t test with Welch’s correction for statistical analysis.
Fig. 4.
Fig. 4.. Misp53R273H/C facilitates cell cycle progression by interacting with p-Rb and E2F4.
(A and B) Immunoblot analysis for p53, E2F1, and β-actin (Actin) upon p53 silencing versus control siRNA (A) and after p53 pulldown, immunoglobulin G (IgG) isotype control, or input (B) in PANC1. n = 3 each. (C) Volcano plot showing the log2(fold change) and the −log10(P value) comparing misp53R273H pulldown to IgG control as determined by mass spectrometry analysis in PANC1. Red dots highlight candidates with a log2(fold change) < −1 or > 1 and q value <0.01. Representative control immunoblot for p53 and Actin after p53 pulldown, IgG, or input. n = 4. (D to G) Immunoblot analysis for p53, p-Rb, Rb, and Actin after p53 pulldown, IgG, or input in PANC1 (D), upon sip53R273H versus siCtrl in PANC1 (E) or sip53R273C versus siCtrl in the PDX cell lines GöCDX62 (F) and GöCDX23 (G). n = 3 each. (H) Model of misp53R273H/C interaction with RBBP4 and phosphorylated p-Rb facilitating cell cycle progression. (I to O) ChIP qRT-PCR in PANC1 upon sip53R273H versus siCtrl showing signal relative to input for Rb pulldown with means ± SD and average IgG isotype control over E2F1 promoter (I), RBL1 promoter (J), PCNA promoter (K), and MYB promoter (L). n = 3 each. (M) Immunoblot analysis for p53, E2F4, and Actin after p53 pulldown, IgG, or input in PANC1. n = 3. (N) to (P) ChIP qRT-PCR in PANC1 showing signal relative to input for E2F4 pulldown with means ± SD and average IgG isotype control over RBL1 promoter (N), E2F1 promoter (O), and PCNA promoter (P). n = 3 each. (Q) Model of misp53R273H/C-mediated cell cycle progression.
Fig. 5.
Fig. 5.. Loss of the misp53R273H/C mutant results in the activation of the MAPK/ERK compensatory pathway.
(A) Immunoblot analysis for p53, cyclin A, cyclin E, and β-actin (Actin) after 24 hours of 5 μM palbociclib treatment in PANC1. n = 3. (B) Cell viability in PANC1 with EV control and stable misp53R273H knockdown (shTP53R273H) upon palbociclib treatment for 24 hours. Relative viability (to control) with means ± SD shown. n = 3 per condition. (C) Immunoblot analysis for p53, p-ERK, ERK, and Actin upon H2O control or after 24 hours of 5 μM palbociclib treatment in PANC1. n = 3. (D) Immunoblot analysis for p53, cyclin A, cyclin E, p-Rb, Rb, p-ERK, ERK, and Actin upon H2O control, 24-hour treatment with 5 μM palbociclib or 24-hour palbociclib followed by 24-hours washout in PANC1 cells. n = 3. (E and F) Immunoblot analysis for p53, p-ERK, ERK, and Actin after misp53R273H/C silencing (sip53R273H/C) versus siCtrl in PANC1 (E) and GöCDX23 (F). n = 3 each. (G) qRT-PCR analysis for the indicated target genes in sip53R273H (red), normalized to siCtrl (gray) in PANC1. Relative mRNA expression with means ± SD shown. n = 3 per condition and target. (H) IHC staining for p-ERK in PANC1 EV and shTP53R273H tumors. Scale bars, 1 mm (tumor overview), 100 μm (left), and 50 μm (right). (I) Quantification of (H). Mean cellular p-ERK optical density per mouse ± SD shown. n = 8 per condition. [(G) and (I)] Student’s t test with Welch’s correction was used to determine the P values. h, hours.
Fig. 6.
Fig. 6.. Combined inhibition of ERK and CDK4/6 effectively counteracts the compensatory mechanism triggered by the loss of misp53R273H/C.
(A and B) Orthotopic PANC1 tumors (see Fig. 3N) were stained in serial sections for p53 and CK19 (A) and p-ERK (B) using IF and IHC, respectively. The positive cell detections for CK19+p53+ and p-ERK+ are indicated in red and yellow, respectively. Density maps of positive cells were created and thresholded to obtain hotspot regions for CK19+p53+ and p-ERK+ cells in the same tumors. Whole-tumor overviews (top) as well as a CK19+p53+ (mid) and a p-ERK+ (bottom) regions of interest are shown. Scale bars, 2 mm (tumor overview), 100 μm (left zoom panels), and 50 μm (right zoom panels). (C) Quantification of CK19+p53+ and p-ERK+ cells relative to the total number of detected cells in the hotspot regions with means ± SD shown. n = 6 per condition. (D) Immunoblot analysis for p53, p-ERK, ERK, and β-actin (Actin) after misp53R273H silencing versus control siRNA or combination of sip53R273H and 10 nM trametinib treatment versus siCtrl with DMSO in PANC1. n = 3. (E) Immunoblot analysis for p53, cyclin A, cyclin E, p-Rb, Rb, p-ERK, ERK, and Actin upon 5 μM palbociclib, 10 nM trametinib or the combination of both for 24 hours versus DMSO control in PANC1. n = 3. (F and G), Mean relative cell numbers after 72-hour treatment with either palbociclib (2.5 to 12.5 μM), trametinib (10 to 30 nM), or the combination in PANC1 (F) and PDAC035T (G). Values were normalized to control DMSO conditions. n = 3. Student’s t test with Welch’s correction was used to determine the P values.

References

    1. Siegel R. L., Miller K. D., Wagle N. S., Jemal A., Cancer statistics, 2023. CA Cancer J. Clin. 73, 17–48 (2023). - PubMed
    1. Manrai M., Tilak T. V. S. V. G. K., Dawra S., Srivastava S., Singh A., Current and emerging therapeutic strategies in pancreatic cancer: Challenges and opportunities. World J. Gastroenterol. 27, 6572–6589 (2021). - PMC - PubMed
    1. Heinemann V., Boeck S., Perioperative management of pancreatic cancer. Ann. Oncol. 19 (Suppl. 7), vii273–vii278 (2008). - PubMed
    1. American Cancer Society, Facts & Figures 2024 (2024); https://cancer.org/research/cancer-facts-statistics/all-cancer-facts-fig.... - PMC - PubMed
    1. Sohal D. P. S., Kennedy E. B., Cinar P., Conroy T., Copur M. S., Crane C. H., Garrido-Laguna I., Lau M. W., Johnson T., Krishnamurthi S., Moravek C., O’Reilly E. M., Philip P. A., Pant S., Shah M. A., Sahai V., Uronis H. E., Zaidi N., Laheru D., Metastatic pancreatic cancer: ASCO guideline update. J. Clin. Oncol. 38, 3217–3230 (2020). - PubMed

MeSH terms

Substances