. 2025 Jul 4;11(27):eadr5240.
doi: 10.1126/sciadv.adr5240. Epub 2025 Jul 4.

Staphylococcus aureus LukMF' targets neutrophils to promote skin and soft tissue infection

Affiliations

Staphylococcus aureus LukMF' targets neutrophils to promote skin and soft tissue infection

Daiane Boff et al. Sci Adv. .

Abstract

Pathogens have evolved to be highly adapted to their natural host. Community-associated methicillin-resistant Staphylococcus aureus USA300, for instance, is a lineage responsible for the epidemic of skin and soft tissue infections (SSTIs) in humans. Owing to its human tropism, mechanisms that enabled the rise of USA300 as a major skin pathogen remain incompletely defined. By leveraging a rodent-adapted strain of S. aureus, we developed a natural model of SSTIs. We found that LukMF', a pore-forming leukocidin homolog to the human-specific LukSF-PV toxin, drives skin pathology in mice. LukMF' lyses neutrophils via the chemokine receptor CCR1, which in turn fuels inflammatory pathology and microbial survival within the infectious nidus. Ablation of CCR1, depletion of neutrophils, or vaccination with LukMF' all protected mice from skin pathology. Thus, these data support epidemiological studies linking leukocidins with human SSTIs and highlight the power of natural models to unearth potential targets to curtail infections.


Figures

Fig. 1.
Fig. 1.. DIP is highly virulent in mice.
(A) Schematic of subcutaneous and intradermal injection in mice. (B) Representative images of skin lesions at 7 days postinfection (dpi) and (C) measurement of lesions size at 2, 4, and 7 days after intradermal infection with 1 × 10⁶ CFU/50 μl of DIP or USA300. Scale bars, 50 μm. Data are representative of three independent experiments (n = 15 mice per group). Lesion size is represented as mean ± SEM and was analyzed with two-way analysis of variance (ANOVA) with Sidak’s multiple comparison test. (D) Representative images of skin lesions at 7 dpi and (E) measurement of lesions size at 2, 4, and 7 days after subcutaneous infection with 1 × 10⁶ CFU/50 μl of DIP or USA300. Data are representative of three independent experiments (n = 15 mice per group). Lesion size is represented as mean ± SEM and was analyzed with two-way ANOVA with Sidak’s multiple comparison test. (F) Heatmap of cytokine and chemokine concentrations in the skin 1, 4, and 7 days after infection with 1 × 10⁶ CFU/50 μl of DIP or USA300 subcutaneously (left) or intradermally (right). Data are shown as the concentration in picogram per milliliter. Data are representative of two independent experiments (n = 5 to 8 per group). Chemokine and cytokine concentrations are expressed as mean and analyzed by two-way ANOVA with Tukey’s multiple comparison test. ****P < 0.0001, ***P < 0.0004, **P < 0.005, and *P < 0.05. Quantification of CFUs in the skin lesions 1 and 7 days after intradermal (G) or subcutaneous (H) infection with DIP or USA300. Each circle represents an individual mouse, and the mean CFU is represented by the horizontal line. Data from two independent experiments are shown (n = 10 mice per group) and were analyzed with one-way ANOVA with Kruskal-Wallis multiple comparison test.
Fig. 2.
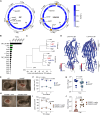
Fig. 2.. LukMF’ is the main virulence factor produced by DIP associated with skin pathology.
(A) Comparative genomics of DIP and USA300. Left, newly sequenced and assembled chromosome of S. aureus strain DIP. Right, chromosome of USA300 strain FPR3757. (B) Secretome analysis of DIP after 24 hours of growth in tryptic soy broth. Top 16 detected proteins with signal peptides and the pore-forming toxins present in culture filtrates is shown (n = 3). PSM, peptide-spectrum match. (C) Phylogenic tree of S. aureus pore-forming toxins. (D) Structure comparisons between PVL and LukMF′. The structural alignments were colored by root mean square deviation (RMSD). (E) Representative images of skin lesions 7 dpi and (F) measurement of lesion size 2, 4, and 7 days after subcutaneous infection with 1 × 10⁶ CFU/50 μl of WT and ΔlukMF′. Data are representative of three independent experiments (n = 15 mice per group). Scale bars, 50 μm. Lesion size is represented as means ± SEM and was analyzed with two-way ANOVA with Sidak’s multiple comparison test. (G) Quantification of CFUs in the skin lesions 7 dpi. Data from three independent experiments are shown (n = 15 to 21 mice per group) were log transformed and analyzed with Mann-Whitney test. (H) Representative images of skin lesions 7 dpi and (I) measurement of lesions size 2, 4, and 7 days after subcutaneous infection with 1 × 10⁶ CFU/50 μl of USA300 + vector and USA300::lukMF′. Data are representative of three independent experiments (n = 15 mice per group). Lesion size is represented as means ± SEM and was analyzed with two-way ANOVA with Sidak’s multiple comparison test. (J) Quantification of CFUs in the skin lesions 7 dpi. Data from three independent experiments are shown (n = 15 to 18 mice per group) were log transformed and analyzed with Mann-Whitney test.
Fig. 3.
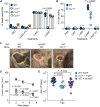
Fig. 3.. LukMF’ targets murine neutrophils through CCR1.
(A) In vitro killing of neutrophils from WT, Ccr1−/−, Ccr2−/−, and Ccr5−/− mice. Thioglycolate-elicited peritoneal cells (PECs) were incubated with purified PVL, LukED, and LukMF′ (50 μg/ml). Cell death was evaluated using viability dye and expressed as % cell death. Data from three independent experiments are shown and analyzed by two-way ANOVA with Tukey test. Data expressed as means with SEM. (B) Flow cytometry–based toxin-binding assay. Thioglycolate-induced PECs were incubated with His-tag recombinant LukF′, LukM, LukMF′, or LukSF-PV (PVL) (5 μg/ml) at 4°C. Toxin binding to neutrophils was determined via flow cytometry using an anti–His tag antibody. Data from two independent experiments (n = 4 mice per group) are shown and analyzed by t test. (C) Representative images of skin lesions at 7 dpi and (D) measurement of lesion size after subcutaneous infection with 1 × 10⁶ CFU/50 μl of DIP and ΔlukMF′ in WT and Ccr1−/− mice. Data are representative of three independent experiments (n = 13 to 17 mice per group). Scale bars, 50 μm. Lesion size is represented as means ± SEM and was analyzed with two-way ANOVA with Sidak’s multiple comparison test. (E) Quantification of CFUs in the skin lesions 7 dpi. Each circle represents an individual mouse (n = 11 to 22 mice per group). Data from three independent experiments are shown and were log transformed and analyzed with Mann-Whitney test.
Fig. 4.
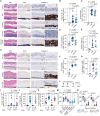
Fig. 4.. Neutrophil death is associated with tissue damage.
(A) Representative images of H&E, Gram, and Caspase-3 staining after 1 day of subcutaneous infection with DIP, ΔlukMF′, USA300, and USA300::lukMF′ compared to an uninfected control. Scale bar, 100 μm (left) and 10 μm (Caspase-3, right). (B) Absolute number, (C) percentage, and (D) the percentage of dead neutrophils in the skin 1 day after infection with DIP, ΔlukMF′, or an uninfected control. Data are representative of three independent experiments (n = 5 to 15 mice per group) and was analyzed with two-way ANOVA with Sidak’s multiple comparison test. (E) Absolute number, (F) percentage, and (G) the percentage of TUNEL+ neutrophils in the skin 1 day after infection with DIP, ΔlukMF′, or an uninfected control. Data are representative of three independent experiments (n = 5 to 15 mice per group) and was analyzed with two-way ANOVA with Sidak’s multiple comparison test. (H) Representative images of H&E, Gram, and Caspase-3 staining of skin from WT and Ccr1−/− mice after 1 day of subcutaneous infection with DIP or mock control. (I) Absolute number, (J) percentage, and (K) the percentage of dead neutrophils in the skin of WT and Ccr1−/− mice 1 day after infection with DIP or mock control. Data are representative of three independent experiments (n = 8 to 20 mice per group) and was analyzed with two-way ANOVA with Sidak’s multiple comparison test. (L) Schematic of neutrophil depletion and infection. (M) Measurement of lesion size after neutrophil depletion and 48 hours after subcutaneous infection with DIP and ΔlukMF′. (N) Impact of adoptive transfer of neutrophils on DIP infection as indicated (donor → recipient). Data are representative of two independent experiments (n = 10 mice per group). Lesion size is represented as means ± SEM and was analyzed with one-tailed Wilcoxon matched-pairs signed rank test.
Fig. 5.
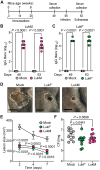
Fig. 5.. Vaccination with LukMF’ reduces the skin pathology in DIP-infected mice.
(A) Schematic of immunizations and infection protocol. Serum IgG titers of LukM (B) and LukF′ (C) immunized mice before (day 49) and 7 days after infection (day 63). Each circle represents an individual mouse. Data are representative of two independent experiments (n = 10 mice per group). IgG titers are expressed as means with SEM. Data were log-transformed and analyzed with one-way ANOVA with Tukey’s multiple comparison test. (D) Representative images of skin lesions at 7 dpi and (E) measurement of lesion size after LukF′, LukM, or mock immunization and subcutaneous infection with 1 × 10⁶ CFU/50 μl of DIP. (F) CFU quantification after LukF′, LukM, or mock immunization and subcutaneous infection with 1 × 10⁶ CFU/50 μl of DIP. Data are representative of two independent experiments (n = 10 mice per group). Lesion size is represented as means ± SEM and was analyzed with two-way ANOVA with Sidak’s multiple comparison test. CFU data were log-transformed and analyzed with one-way ANOVA with Sidak’s multiple comparison test.

References

    1. Wertheim H. F., Melles D. C., Vos M. C., Van Leeuwen W., Van Belkum A., Verbrugh H. A., Nouwen J. L., The role of nasal carriage in Staphylococcus aureus infections. Lancet Infect. Dis. 5, 751–762 (2005). - PubMed
    1. Sakr A., Brégeon F., Mège J.-L., Rolain J.-M., Blin O., Staphylococcus aureus nasal colonization: An update on mechanisms, epidemiology, risk factors, and subsequent infections. Front. Microbiol. 9, 2419 (2018). - PMC - PubMed
    1. Ray G. T., Suaya J. A., Baxter R., Microbiology of skin and soft tissue infections in the age of community-acquired methicillin-resistant Staphylococcus aureus. Diagn. Microbiol. Infect. Dis. 76, 24–30 (2013). - PubMed
    1. Olaniyi R., Pozzi C., Grimaldi L., Bagnoli F., Staphylococcus aureus-associated skin and soft tissue infections: Anatomical localization, epidemiology, therapy and potential prophylaxis. Curr. Top. Microbiol. Immunol. 409, 199–227 (2016). - PubMed
    1. Tong S. Y. C., Davis J. S., Eichenberger E., Holland T. L., Fowler V. G., Staphylococcus aureus infections: Epidemiology, pathophysiology, clinical manifestations, and management. Clin. Microbiol. Rev. 28, 603–661 (2015). - PMC - PubMed

MeSH terms