. 2025 Jul 4;11(27):eadu6361.
doi: 10.1126/sciadv.adu6361. Epub 2025 Jul 4.

Live-cell magnetic manipulation of recycling endosomes reveals their direct effect on actin protrusions to promote invasive migration

Affiliations

Live-cell magnetic manipulation of recycling endosomes reveals their direct effect on actin protrusions to promote invasive migration

Jakub Gemperle et al. Sci Adv. .

Abstract

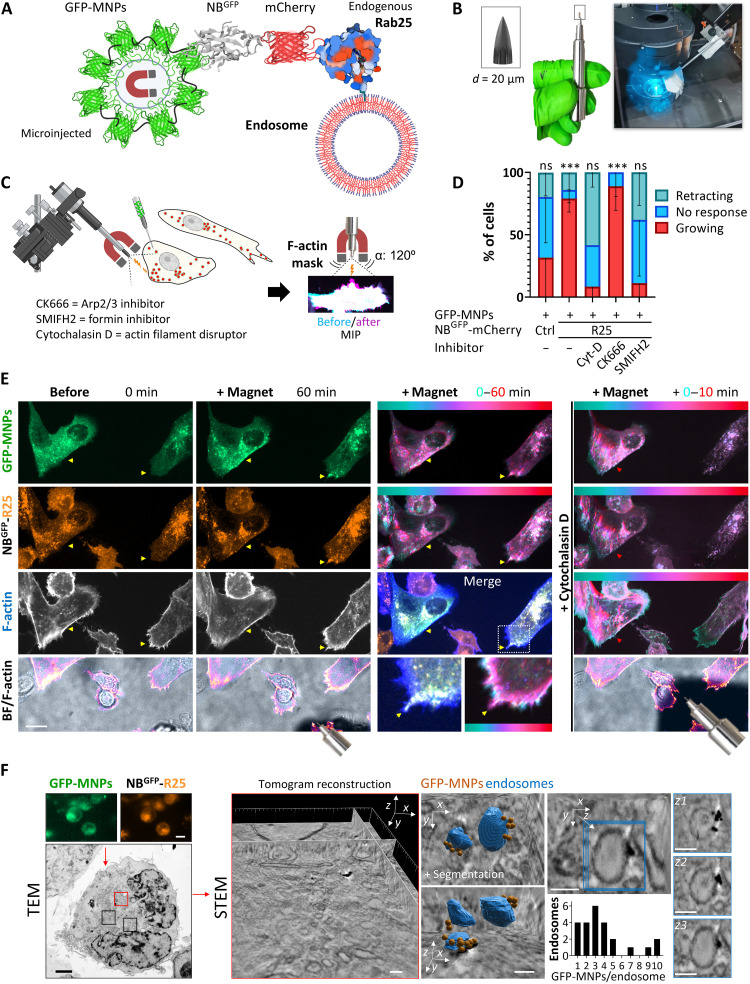
Endocytic recycling pathways play key roles in a broad range of cellular processes, and many vesicle trafficking regulators are implicated in progression of disease such as cancer. The Rab11 family (Rab11a, Rab11b, and Rab25) controls the return of internalized cargos to the plasma membrane, and Rab25 has been implicated in the aggressiveness of cancer by promoting invasive migration. However, while Rab25 vesicles distribute to the leading edge of moving cells, how directly they contribute to cell protrusion is not clear. Here, we adopt a magnetogenetic approach that allows direct manipulation of Rab25 positioning to show that localization to the cell periphery drives the formation of F-actin protrusions. We demonstrate that endogenous Rab25 vesicles coordinate the positioning of key cargos, including the actin regulator FMNL1 and integrin β1, with the activation of Rho guanosine triphosphatases at the plasma membrane to generate and maintain F-actin-rich filopodium-like protrusions and promote cancer cell invasive migration in the three-dimensional matrix.


Figures

Fig. 1.
Fig. 1.. A magnetogenetic approach for remote manipulation of Rab25 (R25) demonstrates a direct role for endosome positioning in cell protrusion growth.
(A) Schematic diagram of the magnetogenetic strategy to control R25 endosomes. (B) Magnetic tip assembly composed of neodymium magnets and a fine wire tip attached to the micromanipulation apparatus. (C) Experimental setup and (D) quantification of protrusion growth: GFP-MNPs delivered by microinjection into randomly selected (independent of initial cell polarity) A2780 cells expressing control NBGFP-mCherry-(Ctrl) or NBGFP-mCherry-R25 cells (DExCon-modified; dox for >94 hours; 250 ng/ml) on FN-coated coverslips and MNPs attracted with a magnetic tip. For each GFP-MNP–positive cell protrusion, growth toward the magnetic tip was analyzed from maximum intensity projections (MIPs) of Lifeact-iRFP670 (F-actin) images. Overlay masks before (0) and after (10 to 60 min) visible magnetic enrichment of GFP-MNPs, n = 19 (Ctrl; N = 5), n = 27 (R25; N = 8), n = 9 [R25; 200 nM cytochalasin D (Cyt-D); N = 2], n = 8 (R25; 100 μM CK666; N = 3), n = 13 (R25; 5 μM SMIFH2, N = 3), means ± SD. Ordinary one-way ANOVA (GraphPad); ***P < 0.001. ns, not significant. (E) Representative spinning-disk confocal time-lapse images of cells with magnetically attracted R25 endosomes before and after cytochalasin D treatment (see movie S2). The shadow in the bright field (BF) indicates the magnetic tip. Yellow arrowheads and cyan-red LUT illustrate changes in GFP-MNPs and vesicle distribution and protrusion growth/filopodia (F-actin) over time through color grading. Scale bar, 20 μm. (F) STEM tomography. GFP-MNPs delivered by electroporation (representative fluorescence images; scale bar, 10 μm); TEM image (scale bar, 2 μm) with a corresponding STEM tomogram (red box; scale bar, 2 μm); zoom (right) with a segmented tomogram and quantification of GFP/MNPs per recycling endosome (50 to 200 nm) (scale bar, 100 nm). Tomogram animation movie S16 is accessible via https://doi.org/10.6084/m9.figshare.22155083. [(A) and (C)] Created in BioRender (https://biorender.com/6wqgouf).
Fig. 2.
Fig. 2.. Endosomes spatiotemporally modulate R25 localization to control protrusion outgrowth.
(A, B, and E) Representative images from confocal spinning-disk live-cell imaging of A2780 stably expressing Lifeact-iRFP670 (F-actin) with NBGFP-mCherry-(Ctrl) or fused with different R25 mutants on FN. (A) Boxed area ×2 magnified images. Arrows, stress fibers. [(B) and (C)] Magnetic attraction and release kinetics of NBGFP-mCherry-(X) and GFP-MNPs (delivered by microinjection); individual representative frames from the white box, kymographs and profiles determined from the changes in fluorescence intensity across the black arrow (normalized 0- to 1-scaled fluorescence intensities), exponentially fitted and quantified in (C); n = 3 (N = 3). (D) Protrusion growth quantified as in Fig. 1 (C and D); n = 14 (R25 wt; N = 3), n = 14 (R25 dC; N = 5), n = 22 (R25 DN/dC; N = 5), means ± SD. Ordinary one-way ANOVA. (E) Representative spinning-disk confocal time-lapse images (MIPs) of cells on FN with magnetically attracted NBGFP-mCherry-R25 dC; zoom inset from the white box (one-matched Z plane; arrows indicate changes). The shadow in the bright field indicates magnetic tip movement (gray arrow), and the corresponding alteration in cell shape is outlined by a yellow line. Color-grade time lapse (cyan-red LUT, arrow). See movie S3. (F) Schematic diagram of the alternative strategy to control R25 endosomes on the basis of the NBGFP module and GFP-tagged C-terminally truncated molecular motor Kif5b[1-807] (created with BioRender.com, https://biorender.com/f9jfcq2). (G) Representative confocal spinning-disk live-cell images of A2780 on FN stably coexpressing Lifeact-iRFP670 (F-actin) and NBGFP-mCherry-(Ctrl) or fused with different R25 mutants and GFP-Kif5b[1-807] sorted as shown in fig. S6C (dox for 48 hours, 500 ng/ml; MIPs). FN-coated 96-well plate (Cellvis, #1.5H cover glass). Quantified in (H) is the number (n) of narrow protrusions (width ≤5 μm) per cell [yellow arrows in (G), example]. ANOVA on ranks with Dunn’s test (compared to the variant without Kif5b); n > 50 cells (N = 3). *P < 0.05; **P < 0.01; ***P < 0.001; ****P < 0.001. For the quantification of cell length, see fig. S6E. All scale bars, 10 μm.
Fig. 3.
Fig. 3.. Manipulation of R25 recycling endosomes in living cells migrating in a 3D matrix triggers robust F-actin protrusion.
(A to H) Representative images from confocal spinning-disk live-cell imaging. A2780 DExCon-modified NBGFP-mCherry-R25 cells (see fig. S1) pretreated with dox (72 hours; 250 ng/ml) expressing Lifeact-iRFP670 (F-actin) migrating in 3D CDMs. GFP-MNPs delivered by microinjection and repeatedly relocalized using a magnetic tip (movement specified) as depicted in (G) (created in BioRender, https://biorender.com/u40q760) in the presence or absence of different indicated inhibitors. See movie S4. N = 3. [(A) to (F)] Masks created from F-actin images (solid colors overlaid from preceding and following events). Arrowheads, gradient of GFP-MNPs. Color-grade (cyan-red) LUT images show changes in vesicles (NBGFP-mCh-R25)/GFP-MNP distribution and cell shape (F-actin) in time. The relative stress map [inset in (B)] is displayed as a vectorial plot with red-blue LUT; the size and direction of vectorial arrows illustrate force distribution exerted on CDMs. Scale bar, 20 μm. [(H) and (I)] AI-based tracking of vesicle (NBGFP-mCh-R25) movement (labeled blue, static; red, toward the rear; green, toward the front) using kymographs (generated from the yellow dashed line) and Kymobutler plug-in during experiment shown in (A) to (F). Note that the ultrafast phase kymograph (A) of vesicle movement was corrected by eye. The position of the magnet relative to the cell front and rear is shown. The total quantification of (H) is shown in (I).
Fig. 4.
Fig. 4.. R25 recycling endosomes recruit FMNL1.
(A) Representative confocal spinning-disk images of A2780 DExCon-modified NBGFP-mCherry-R25 cells (mCherry, orange/amber) pretreated with dox (>94 hours; 250 ng/ml) immunolabeled for FMNL1 (green, anti-FMNL1, Alexa Fluor 488) and stained for F-actin (blue, phalloidin-Alexa Fluor 633). Red dotted line, line scan profile of normalized 0- to 1-scaled fluorescence intensities. White box, zoom inset (MIP) with cross sections. FN-coated μ-Plate 96 plate (#1.5 IbiTreat). Scale bar, 10 μm. (B and C) BioID experiment. A2780 stably expressing BirA fused R25 wt or mutants (dC, DN, and DN/dC) cultured with biotin (1 μM biotin, 16 hours). Lysates equalized to the total protein amount and biotinylated proteins pulled down with streptavidin beads (Ctrl, no BirA). (B) Immunoblots (IBs) of pulled-down FMNL1, BirA (Myc epitope), and streptavidin (StrepA) as the loading control. Fluorescent antibodies are shown in black and white. (C) Quantification of pulled-down FMNL1 from immunoblots. The graph shows band intensities normalized to individual BirA levels and relative to BirA-R25 wt values (background from Ctrl sample subtracted). Means ± SD; N = 3. One-way ANOVA analysis with Tukey post hoc test (compared to DN or dC or as indicated); *P < 0.05; ****P < 0.001. (D) Schematic diagram of the strategy to enforce the proximity of FMNL1β with R25 wt or dC mutant unable to bind endosomes by the interaction of GFP(-FMNL1) and NBGFP(-mCherry-R25). Created with BioRender.com (https://biorender.com/f9jfcq2). (E) Representative confocal spinning-disk live-cell images of A2780 stably coexpressing Lifeact-iRFP670 (F-actin) and GFP-FMNL1β with NBGFP-mCherry-(Ctrl) or fused with different R25 mutants. The cell shape is outlined in yellow. The zoom inset from the white box is shown as MIP with cross sections. FN-coated 96-well plate (Cellvis, #1.5H cover glass). Scale bar, 10 μm. Quantified in (F) as % of cells with the FMNL1 β perinuclear hotspot as shown in (E). The box plot shows the median and 25th and 75th percentiles with whiskers reaching the last data point; n > 55 cells per condition; N = 3. One-way ANOVA analysis with Tukey post hoc test (compared to Ctrl); ****P < 0.001.
Fig. 5.
Fig. 5.. Magnetic spatiotemporal control of R25 endosomes modulates F-actin polymerization in protrusions via FMNL1.
(A) Strategy to efficiently deplete FMNL1 using a smart pool of siRNAs in an FMNL+/− heterozygous background previously created by the CRISPR-Cas9 editing (see also fig. S10, C and D; for details, see Methods). Created with BioRender.com (https://biorender.com/nsezjwg). (B and D) Representative frames from confocal spinning-disk live-cell time-lapse images of A2780 DExCon-modified NBGFP-mCherry-R25 FMNL1+/+ or FMNL1+/− cells (dox treated for >94 hours; 250 ng/ml) stably expressing Lifeact-iRFP670 (F-actin) on FN, microinjected with GFP-MNPs and nucleofected with chemically modified siRNApool anti-FMNL1 or nontargeting Ctrl siRNA (see Methods) as indicated. Experiments were performed 5 days after (for immunoblots, see fig. S10D). R25 endosomes attracted using a magnetic tip (shown by cartoon; arrows indicate movement). Red arrows (time 0) or yellow/white arrows (later time point) indicate the outcome. MIPs if not stated otherwise. Zoomed insets correspond to areas indicated by boxed areas. Scale bar, 10 μm. Quantification in (C) as in Fig. 1 (C and D) as % of cells showing changes in protrusion growth toward the magnetic tip; n = 12 (siRNA Ctrl; N = 3) and n = 14 (siRNApool anti-FMNL1; N = 3; see movie S6), means ± SD. Ordinary one-way ANOVA (GraphPad); ****P < 0.001. (D) Representative images from confocal spinning-disk live imaging of cells in 3D CDMs; N = 3. MIP (top) or one-matched (0/40 min) Z plane is shown (bottom). Dashed line, cell edge (F-actin) at time 0. The color-grade (cyan-red) LUT image shows changes in GFP-MNP distribution in time. See movies S7 and S8.
Fig. 6.
Fig. 6.. R25 recycling endosomes serve as signaling platforms for RhoA/FMNL1 activity.
(A, C, and D) Representative spinning-disk live-cell images of A2780 DExCon-modified NBGFP-mCherry-R25 (dox for >72 hours; 250 ng/ml) or (E) A2780 NBGFP-mCherry-R25 dC stably coexpressing active RhoA probe iRFP6703x-RBD4x (RBD4x). GFP-MNPs microinjected (green). Color-grade (cyan-red) LUT image, changes in mCherry/GFP-MNPs/RBD4x in time (generated from the one-matched Z plane). Yellow arrowheads/arrows, mCherry/GFP-MNPs/RBD4x signal enrichment/changes/movement. Magnetic tip position, shadow/cartoon (white arrows, movement). Cell shape, yellow line outline in merged/bright-field images. Scale bar, 20 μm. (A) MIPs with cross sections and cells on FN. Arrow, PNRC. Quantified in (B) as the percentage of cells with the fluorescent signal of RBD4x visibly enriched at the PNRC spot ± R25 (±dox for 48 h; n > 60 cells, N = 3) ± siRNApool anti-FMNL1 (n > 40 cells, N = 2). One-way ANOVA with Tukey’s multiple comparison test; *P < 0.05; **P < 0.01. (C) Cells on FN; one-matched Z plane for all. See movie S9. White boxed areas, ×3 color-grade LUT images for individual channels with indicated zoomed insets (bottom); blue box, higher contrast. Circle 1, zoomed inset of ROI1 (time interval, 500 s = i). Circle 2 with a yellow dotted line, zoomed inset of ROI2 as the kymograph. (D) 3D CDM. GFP-MNPs/RBD4x merge, MIPs. Top inset: −2.5 min; no magnet. Movie S22 is accessible via https://doi.org/10.6084/m9.figshare.22155083. (E) FN-coated coverslip. One-matched Z plane for all. See movie S10. Yellow circle, zoomed inset of time lapse for individual channels. Black circle and black dashed line, zoomed inset as the kymograph for individual channels. Blue dashed line across the kymograph, line scan profile of normalized 0- to 1-scaled fluorescence intensities. (F) Schematic model summarizing our results: R25 endosomes serve as a platform for the spatiotemporal control of R25 activity (possible to directly modulate using magnetogenetics). This locally modulates RhoA activity to promote actin polymerization in both actin tracks and nascent protrusions through the FMNL1-dependent actin nucleation mechanism while simultaneously delivering integrin receptors for protrusion formation/stabilization. Created with BioRender.com (https://biorender.com/1pdoxf0).

Similar articles

Cited by

References

    1. Jacquemet G., Humphries M. J., Caswell P. T., Role of adhesion receptor trafficking in 3D cell migration. Curr. Opin. Cell Biol. 25, 627–632 (2013). - PMC - PubMed
    1. Scita G., Di Fiore P. P., The endocytic matrix. Nature 463, 464–473 (2010). - PubMed
    1. Golachowska M. R., Hoekstra D., van IJzendoorn S. C. D., Recycling endosomes in apical plasma membrane domain formation and epithelial cell polarity. Trends Cell Biol. 20, 618–626 (2010). - PubMed
    1. Jin H., Tang Y., Yang L., Peng X., Li B., Fan Q., Wei S., Yang S., Li X., Wu B., Huang M., Tang S., Liu J., Li H., Rab GTPases: Central coordinators of membrane trafficking in cancer. Front. Cell Dev. Biol. 9, 648384 (2021). - PMC - PubMed
    1. Kelly E. E., Horgan C. P., McCaffrey M. W., Rab11 proteins in health and disease. Biochem. Soc. Trans. 40, 1360–1367 (2012). - PubMed

LinkOut - more resources