

Risk Factors for Lower Extremity Deep Vein Thrombosis by Spinal Cord Injury Level: A Population-Based Analysis
- PMID: 40614247
- PMCID: PMC12227433
- DOI: 10.1177/21925682251358721
Risk Factors for Lower Extremity Deep Vein Thrombosis by Spinal Cord Injury Level: A Population-Based Analysis
Abstract
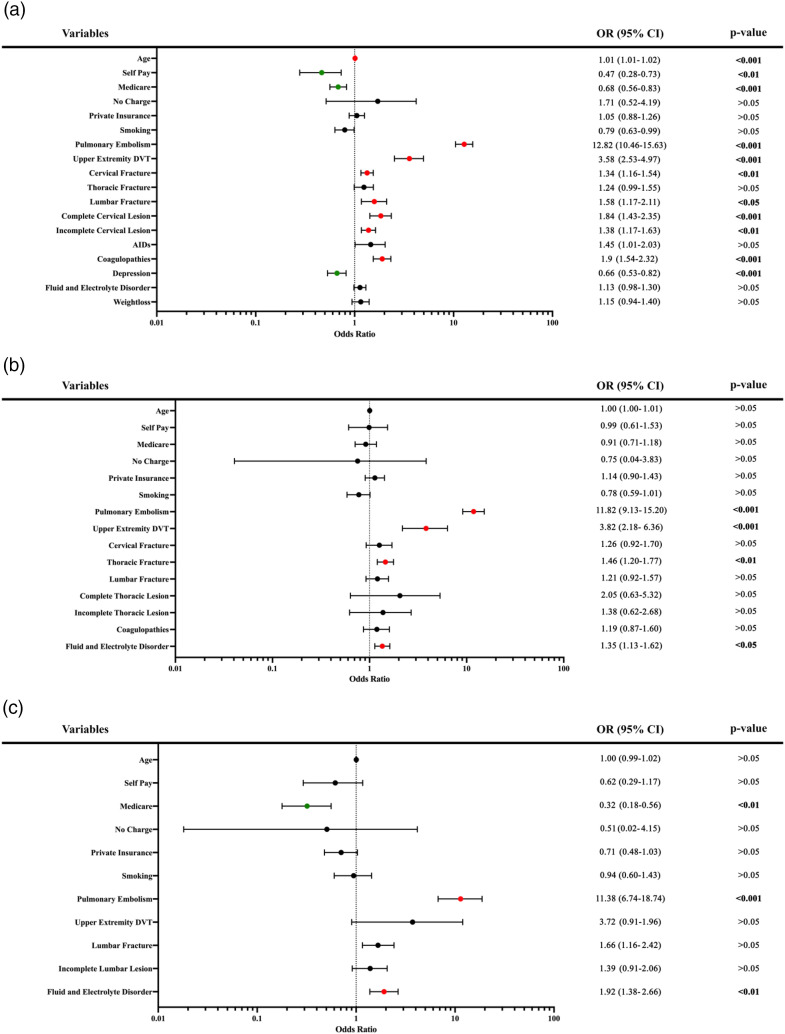
Study DesignA retrospective database analysis.ObjectiveTo determine the incidence of lower extremity deep vein thrombosis (DVT) and identify risk factors associated with DVT development in patients with spinal cord injury (SCI), stratified by level of injury.MethodsThe National Inpatient Sample from 2016 to 2021 was used to identify adult inpatients with SCI who developed DVT within the same admission and to categorize them by anatomical injury level. Multivariable logistic regression was used to assess independent risk factors by SCI level.ResultsAmong 59,498 SCI patients, the overall DVT incidence was 2.8%. The DVT rate was lowest in cervical SCI (2.6%) and highest in thoracic SCI (3.2%). Pulmonary embolism was a strong independent risk factor for DVT across all SCI levels ([Cervical] OR: 12.82, CI: 10.46-15.63, [Thoracic] OR: 11.82, CI: 9.13-15.20, [Lumbar] OR: 11.38, CI: 6.74-18.74). For cervical SCI, risk factors included coagulopathies (OR: 1.90, CI: 1.54-2.32), older age (OR: 1.01, CI: 1.01-1.02), complete (OR: 1.84, CI: 1.43-2.35) or incomplete cervical lesion (OR: 1.38, CI: 1.17-1.63), cervical (OR: 1.34, CI: 1.16-1.54) or lumbar fracture (OR: 1.58, CI: 1.17-2.11), and upper extremity DVT (OR: 3.58, CI: 2.53-4.97). For thoracic SCI, risk factors included thoracic fracture (OR: 1.46, CI: 1.20-1.77), upper extremity DVT (OR: 3.82, CI: 2.18-6.36), and fluid/electrolyte disorder (OR: 1.35, CI: 1.13-1.62). For lumbar SCI, fluid/electrolyte disorder (OR: 1.92, CI: 1.38-2.66) was an independent predictor.ConclusionDVT incidence and risk factors vary by SCI level. Identifying these factors is critical for stratifying care and developing tailored prophylactic strategies that prevent adverse events and optimize patient outcomes.
Keywords: NIS; cervical; deep vein thrombosis; lumbar; risk factors; spinal cord injury; thoracic; trauma.
Conflict of interest statement
The author(s) declared no potential conflicts of interest with respect to the research, authorship, and/or publication of this article.
Figures
Similar articles
-
Home versus in-patient treatment for deep vein thrombosis.Cochrane Database Syst Rev. 2018 Jan 9;1(1):CD003076. doi: 10.1002/14651858.CD003076.pub3. Cochrane Database Syst Rev. 2018. PMID: 29315455 Free PMC article.
-
The measurement and monitoring of surgical adverse events.Health Technol Assess. 2001;5(22):1-194. doi: 10.3310/hta5220. Health Technol Assess. 2001. PMID: 11532239
-
Role of screening tests for deep venous thrombosis in asymptomatic adults with acute spinal cord injury: an evidence-based analysis.Spine (Phila Pa 1976). 2007 Aug 1;32(17):1908-16. doi: 10.1097/BRS.0b013e31811ec26a. Spine (Phila Pa 1976). 2007. PMID: 17762301
-
Antiplatelet agents for the treatment of deep venous thrombosis.Cochrane Database Syst Rev. 2022 Jul 25;7(7):CD012369. doi: 10.1002/14651858.CD012369.pub2. Cochrane Database Syst Rev. 2022. PMID: 35876829 Free PMC article.
-
High Risk of Venous Thromboembolism With Aspirin Prophylaxis After THA for High-riding Developmental Dysplasia of the Hip: A Retrospective, Comparative Study.Clin Orthop Relat Res. 2025 Jun 9. doi: 10.1097/CORR.0000000000003482. Online ahead of print. Clin Orthop Relat Res. 2025. PMID: 40536765
References
LinkOut - more resources
Full Text Sources
