. 2025 Jul 4;16(1):6177.
doi: 10.1038/s41467-025-61184-4.

Single-cell analysis of dup15q syndrome reveals developmental and postnatal molecular changes in autism

Affiliations

Single-cell analysis of dup15q syndrome reveals developmental and postnatal molecular changes in autism

Yonatan Perez et al. Nat Commun. .

Abstract

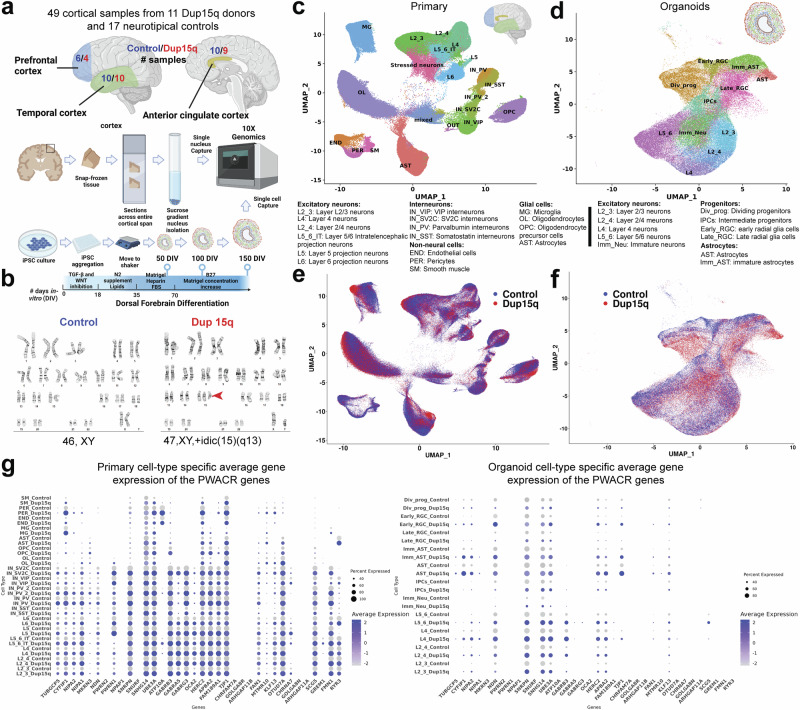
Duplication 15q (dup15q) syndrome is a leading genetic cause of autism spectrum disorder, offering a key model for studying autism-related mechanisms. Using single-cell and single-nucleus RNA sequencing of cortical organoids from dup15q patient-derived iPSCs and post-mortem brain samples, we identify increased glycolysis, disrupted layer-specific marker expression, and aberrant morphology in deep-layer neurons during fetal-stage organoid development. In adolescent-adult postmortem brains, upper-layer neurons exhibit heightened transcriptional burden related to synaptic signaling, a pattern shared with idiopathic autism. Using spatial transcriptomics, we confirm these cell-type-specific disruptions in brain tissue. By gene co-expression network analysis, we reveal disease-associated modules that are well preserved between postmortem and organoid samples, suggesting metabolic dysregulation that may lead to altered neuron projection, synaptic dysfunction, and neuron hyperexcitability in dup15q syndrome.


Conflict of interest statement

Competing interests: The authors declare no competing interests.

Figures

Fig. 1
Fig. 1. Comprehensive single-cell molecular profiling of dup15q syndrome using postmortem cortical samples and cortical organoids.
a Illustration of experimental design, sample collection, and cell capture. Some elements were created in BioRender. Perez, J. (2025) https://BioRender.com/nvvwyh3. b G-banding karyotype of normal and idic(15q) iPSC lines. c Unbiased clustering of single nuclei and annotated cell types of postmortem samples. Some elements were created in BioRender. Perez, J. (2025) https://BioRender.com/6z5et7u. d Unbiased clustering of cortical organoid single cells and annotated cell types. Some elements were created in BioRender. Perez, J. (2025) https://BioRender.com/rpjlezb. e Primary nuclei clustered by genotype, showing equal contribution of dup15q and control samples to all cell types. f Organoid cells clustered by genotype, showing similar contributions from dup15q and control organoids to all cell types. g Cell-type-specific average expression of the duplicated genes within the PWACR region in primary and organoid cells.
Fig. 2
Fig. 2. Dup15q deep-layer neurons exhibit increased glycolysis, degraded neuronal-layer identity, and aberrant morphology.
a Gene burden analysis of primary and cortical organoid cell types. (Differential gene expression was calculated from random 500 nuclei/cells of the control and dup15q groups per cell-type. This analysis was repeated across 10 permutations. Box plots show the median and interquartile range; no whiskers are displayed; P values were calculated by comparing numbers of DEGs between cell types using two-sided Mann-Whitney U test). b GO analysis of overlapping primary and organoid cortical deep-layer (DL) neurons DEGs, highlighting negative regulation of neuron projection as a common process. Some elements were created in BioRender. Perez, J. (2025) https://BioRender.com/6z5et7u; https://BioRender.com/rpjlezb. c GO analysis of organoid early_RGC and DL neurons overexpressed genes showing enrichment of glycolysis associated terms. d Pseudotime analysis identifies developmental trajectories and dynamic gene expression changes along deep-layer (DL) neuron differentiation (left). Log-transformed average expression of glycolysis and TCA cycle gene panels are plotted over pseudotime (right). Individual gene-level P-values were calculated using tradeSeq (fitGAM and patternTest, two-sided). Following multiple testing correction, a combined meta P-value was computed using the logitp method; P = 2.47 × 10-07). e Immunofluorescence (IF) and co-expression analysis of deep-layer (DL) and upper-layer (UL) neuronal markers in organoids, with quantification. (Scale bar = 100 µm. White arrowheads indicate co-expression of BCL11B and SATB2. Plots show the percentage of co-expressing cells among DL neurons. For SATB2, quantification was based on 22 randomly selected images from three control organoid lines and 19 randomly selected images from three Dup15q organoid lines. For MEF2C, quantification was based on 22 randomly selected images from three control organoid lines and 15 images from three Dup15q organoid lines. All organoids were derived from the same differentiation batch. Data are presented as mean values +/- SD; **P = 0.0026; ***P < 0.0001, two-sided unpaired t-test). f Illustration of cortical organoid cell dissociation, AAV labeling, and xenotransplantation (Scale bars = 100 µm). Some elements were created in BioRender. Perez, J. (2025) https://BioRender.com/rpjlezb; https://BioRender.com/zf6ehax; https://BioRender.com/h4hyuuj. g IF-staining and deep-layer neurite tracing for Sholl analysis (Scale bar = 50 μm). h Sholl analysis of deep-layer neurons. (Data are presented as individual points at mean +/-SEM; *P < 0.05, **P < 0.005; ***P < 0.0005, unpaired two-sided t-test, actual P values are presented in Data Source; n = 11 from two lines for controls; n = 19 from three lines for dup15q). i Sholl area under the curve analysis (Data are presented as mean values +/- SD; p-value represents unpaired two-sided t-test, P = 0.0001). Some figure elements were created with BioRender. Perez, J. (2025).
Fig. 3
Fig. 3. Spatially resolved transcriptomics of the dup15q syndrome prefrontal cortex.
a Annotated cell clusters overlaid on tissue images using cell coordinates (left; Scale bar = 1 mm). Individual cell type-specific channel images show comparable cell type identification and spatial localization of dup15q patient and control clusters (right). b Examples of cell-type-specific differential gene expression validated by spatially resolved transcriptomics (Scale bar = 1 mm). c Correlation of spatial transcriptomic gene expression profiles for excitatory neurons. The top differentially expressed genes are in red (p-values were calculated using two-sided Wilcoxon Rank Sum and adjusted for multiple comparisons using Benjamini–Hochberg (BH) method. P-value < 0.01; Actual P values reported in Source Data).
Fig. 4
Fig. 4. Converged molecular changes of UL neurons between dup15q syndrome and idiopathic ASD.
a Pearson’s correlation (two-sided) was used to assess the linear relationship between gene expression changes in Dup15q and idiopathic ASD (iASD) across all cell types (left) or between upper layer neurons alone (right). Pearson’s r and p-values are shown. Only genes passing FDR < 0.05 were included. Comparisons of DEG fold changes between idiopathic ASD (iASD) and dup15q syndrome across cell types together (left) and for UL neurons separately (right). (r = Pearson coefficient, p = Pearsons p value). b Differential expression of idiopathic ASD (iASD) and dup15q syndrome shared genes in UL cortical neurons. c GO analysis of idiopathic autism (iASD) and dup15q syndrome UL neuron DEGs. Some elements were created in BioRender. Perez, J. (2025) https://BioRender.com/tinyjx3. d Violin plots of selected dup15q region-specific gene expression q values represent BH corrected False-discovery rates. Some elements were created in BioRender. Perez, J. (2025) https://BioRender.com/6z5et7u. e Pearson’s correlation coefficients were calculated to assess the similarity of differential gene expression (log2 fold changes) between cortical regions for each cell type within the Dup15q vs. control comparison. All correlations were evaluated using a two-sided test, exact p-values are reported in Supplementary Dataset S10. f GO analysis of dup15q region-specific genes. Some figure elements were created with BioRender. Perez, J. (2025).
Fig. 5
Fig. 5. Weighted gene co-expression networks (WGCNA) of organoid and primary dup15q DL neurons.
a WGCNA dendrograms of primary and organoid deep-layer (DL) neurons. Each leaf represents a single gene, and the colors on the bottom represent the assignment of co-expression modules. Some elements were created in BioRender. Perez, J. (2025) https://BioRender.com/6z5et7u; https://BioRender.com/rpjlezb. b Module preservation analysis of primary DL neurons. (Zsummary.qual scores >10 indicate high robustness of module quality; Zsummary.pres >10 indicating strong preservation of the primary modules in the organoid network). c Module trait correlation analysis of primary DL neuron modules. The red arrows indicate down or upregulated well-preserved modules (L5_6.2 and L5_6.7) association with the dup15q genotype. Pearson correlation was used to assess the relationship between module eigengenes and Dup15q diagnosis. p-values were calculated using a two-sided test. Asterisks denote p value significance levels *p < 0.05, **p < 0.01, and ***p < 0.001. d GO enrichment analysis of L5_6.2 module, showing enrichment for glycolysis pathways. e Violin plots, showing the moderate upregulation of L5_6.2 module glycolysis genes in primary DL neurons. f Module network plots of primary DL neurons highlight each network’s top 25 hub genes. Gene font size was scaled to represent each gene’s eigengene-based connectivity (kME). Hub genes associated with glycolysis (L5_6.2) and synaptic functions (L5_6.7) are in red. Some figure elements were created with BioRender. Perez, J. (2025).

Update of

References

    1. Sandin, S. et al. The Heritability of Autism Spectrum Disorder. JAMA318, 1182–1184 (2017). - PMC - PubMed
    1. Parikshak, N. N. et al. XIntegrative functional genomic analyses implicate specific molecular pathways and circuits in autism. Cell155, 1008 (2013). - PMC - PubMed
    1. Suzuki, K. et al. Microglial Activation in Young Adults With Autism Spectrum Disorder. JAMA Psychiatry70, 49–58 (2013). - PubMed
    1. Parikshak, N. N. et al. Genome-wide changes in lncRNA, splicing, and regional gene expression patterns in autism. Nature540, 423–427 (2016). - PMC - PubMed
    1. Velmeshev, D. et al. Single-cell genomics identifies cell type–specific molecular changes in autism. Sci. (80-).364, 685–689 (2019). - PMC - PubMed

MeSH terms

Supplementary concepts