. 2025 Jul 4;16(1):6173.
doi: 10.1038/s41467-025-61174-6.

Structural-functional characterization of the MIRO1-TRAK1 complex

Affiliations

Structural-functional characterization of the MIRO1-TRAK1 complex

Erika E Ravitch et al. Nat Commun. .

Abstract

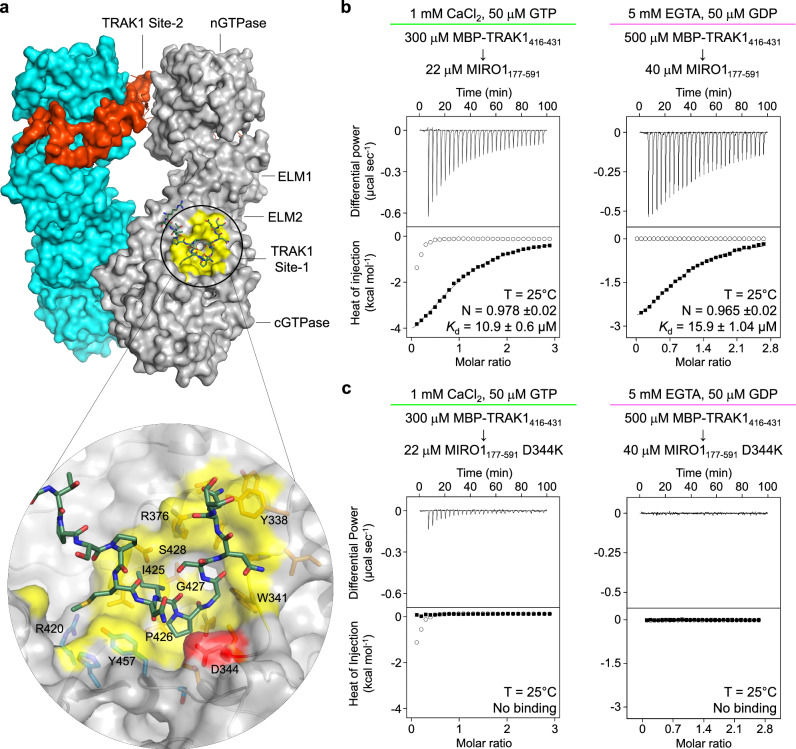
Mitochondrial Rho GTPase (MIRO) features N- and C-terminal GTPase domains (nGTPase and cGTPase) flanking two pairs of EF-hands, and functions as a master scaffold on the outer mitochondrial membrane. It regulates mitochondrial motility by recruiting trafficking kinesin-binding protein (TRAK), which in turn recruits kinesin-1 and dynein-dynactin. The MIRO-TRAK interaction remains incompletely understood. Here, we describe the cryo-electron microscopy structure of TRAK1569-623 bound to MIRO1. The complex forms a dimer, mediated by interactions through the second EF-hand pair, cGTPase, and TRAK1. TRAK1569-623 binds in a cleft between the nGTPase and first EF-hand pair, inserting side chains into hydrophobic pockets of both domains. Another MIRO1-binding site involves TRAK1425-428, which binds in a pocket between the second EF-hand pair and cGTPase. Both binding sites are validated by mutagenesis and binding assays, showing no clear dependence on cofactor conditions (calcium or nucleotide). In cells, both sites contribute to TRAK1's mitochondrial localization.


Conflict of interest statement

Competing interests: The authors declare no competing interests.

Figures

Fig. 1
Fig. 1. Cryo-EM structure of TRAK1569-623 bound to MIRO11-591.
a Domain diagrams of human MIRO1 and TRAK1, highlighting the conserved regions CR2 and CR4, which contain the MIRO1 binding Site-1 and Site-2, respectively. Secondary structure elements within Site-2 are shown in a cartoon representation below the sequence. Each EF-hand ligand mimic (ELM) domain consists of two EF-hands and a ligand mimic helix, with only the first EF-hand binding Ca2+. b Two perpendicular views of the cryo-EM map of the MIRO1-TRAK1 dimer, colored and labeled by domains (as in part a). Bound cofactors (GTP, Mg2+, and Ca2+) are highlighted in the ribbon diagram on the right. c Close-up views of specific interactions between MIRO1 and Site-2 of TRAK1, numbered 1 to 6 from N- to C-terminus. MIRO1 is shown as a transparent electrostatic surface. The image in the center shows the cryo-EM map extracted around Site-2 and indicates the location of each close-up view (labeled 1-6).
Fig. 2
Fig. 2. MIRO1-TRAK1 contact surfaces and dimerization.
a Structure of the MIRO11-591-TRAK1569-623 dimeric complex, with MIRO1 monomers shown in cyan and gray and Site-2 of TRAK1 in red. Red cylinders indicate the likely location of the transmembrane helices as they extend from the structure. b Contact surfaces (yellow) of Site-2 on MIRO1 (1915 Å2, top) and MIRO1 on Site-2 (2065 Å2, bottom). c MIRO1 dimerization interface shown as a surface representation (cyan, left) and a ribbon diagram (right). ELM2, ELM2-cGTPase linker, and cGTPase are colored orange, magenta, and blue, respectively. Contact surface areas were calculated using the SPPIDER server (https://sppider.cchmc.org/). d Anti-parallel β-sheet formed by TRAK1 residues Q575-V577. e The last observed MIRO1 residue in the structure, L587, is positioned <20 Å from its counterpart in the other dimer subunit, suggesting that the transmembrane helices are closely spaced as they insert into the outer mitochondrial membrane. f Representative mass photometry data for MIRO11-591 alone and with TRAK1569-623 from fraction 16 (see also Supplementary Fig. 5). Mass photometry and cryo-EM samples were prepared using GraFix. Data are presented as histograms normalized to the bin with the highest number of counts (bin width = 6.1 kDa). The average mass, standard deviation, and percent of counts are derived from Gaussian fits.
Fig. 3
Fig. 3. MIRO1-TRAK1 interaction as a function of the Ca2+ and nucleotide state.
a, b HPLC analysis and quantification of nucleotide bound to MIRO11-591, MBP-MIRO11-180, and MIRO1177-591. Proteins were purified and incubated for 15 min, respectively, with 10- and 35-fold molar excesses of nucleotide (GDP, pink trace; GTP, green trace). The normalized maximum absorbance at 256 nm is plotted as a function of retention time. c, e Representative SDS-PAGE analyses of MIRO11-591 pulled down by either MBP-TRAK1569-623 or MBP-TRAK1416-446,561-623 prepared under GTP or GDP conditions (as described in part a), with either 1 mM CaCl2 or 5 mM EGTA added during incubation. From left to right, the gel lanes correspond to the MIRO11-591 load control and amylose pulldowns of MIRO11-591, TRAK1 constructs, and MIRO11-591 + TRAK1 constructs. d, f Densitometric quantification of the pulldowns. Three biological replicates (N = 3), each comprising three technical replicates, were performed using different MIRO11-591 preparations. Data from each biological replicate are represented by distinct symbols (triangles, circles, or squares), with their corresponding averages outlined in black. For each MBP-TRAK1 construct and cofactor condition, replicates are normalized to the average of the CaCl2/GTP condition for that replicate. Colored bars (matching the gel contours in parts c, e) and brackets indicate the mean ± SD for the biological replicates. Statistical analysis was performed using a right-tailed one-way ANOVA with Tukey’s multiple comparisons test, revealing no statistically significant differences among the experiments (p > 0.05). Full gels and quantifications are provided in the Source Data file.
Fig. 4
Fig. 4. Mutagenesis analysis of the role of TRAK1 Site-1 and Site-2 in MIRO1 binding.
a Sequence alignment of a subgroup of TRAK1/2 from 183 vertebrate sequences (Supplementary Fig. 1a), highlighting conserved region 4 (CR4). Amino acids conserved in 85–97% and 97–100% of the sequences are shaded in light and dark blue, respectively. Residues W589 and L597, which were mutated to aspartate (W589D and L597D), are marked with stars. b, d Representative SDS-PAGE analyses of MIRO11-591 pulldown by wild-type (WT), W589D, and L597D variants of MBP-TRAK1569-623 and MBP-TRAK1416-446,561-623 (n = 4). Pulldowns were performed in the presence of 1 mM CaCl2 and 50 µM GTP. From left to right, the gel lanes correspond to the MIRO11-591 load control, and amylose pulldowns of MIRO11-591, MBP-TRAK1 constructs, and MIRO11-591 + MBP-TRAK1 constructs. c, e Densitometric quantification of the pulldowns. Colored bars (matching the gel contours in parts b and d) and brackets represent the mean ± SD for each pulldown condition. Data are normalized to the average of the corresponding WT MBP-TRAK1 construct. Statistical analyses were performed using a right-tailed one-way ANOVA with Tukey’s multiple comparisons test. P-values: part c (WT vs W589D p < 0.0001, WT vs L597D p < 0.0001, W589D vs L597D p = 0.9754), part e (WT vs W589D p < 0.0001, WT vs L597D p = 0.0019, W589D vs L597D p = 0.0001). P-values are also indicated in the figures, with ns for p > 0.05. Gels and quantifications are provided in the Source Data file.
Fig. 5
Fig. 5. Characterization of the TRAK1 Site-1 interaction with MIRO1.
a Surface representation of the MIRO11-591-TRAK1569-623 dimeric complex, highlighting the pocket (yellow) where AlphaFold3 predicts TRAK1 Site-1 (shown in all-atom representation) binds at the interface between ELM2 and cGTPase. The per-residue confidence of this prediction, as indicated by the predicted local distance difference test (pLDDT) score and the predicted aligned error (PAE), is shown in Supplementary Fig. 7a, b. A close-up view displays details of the interaction using surface and all-atom representations, with MIRO1 residue D344 (mutated to lysine to validate this interaction) shown in red. b, c ITC titrations of MBP-TRAK1416-431 into MIRO1177-591 wild-type and mutant D344K in the presence of 1 mM CaCl2 and 50 µM GTP (left) or 5 mM EGTA and 50 µM GDP (right). The experimental conditions and fitting parameters (stoichiometry, N; dissociation constant, Kd) are indicated with each graph.
Fig. 6
Fig. 6. Role of Site-1 and Site-2 in MIRO1-mediated recruitment of TRAK1 to mitochondria.
a, c Representative maximum-intensity projections of Halo-tagged TRAK11-640 wild-type (WT) and Site-2 mutants (W589D, L597D, and W589D + L597D) or Site-1/Site-2 mutants (425IPG427 ⟶ AAA, W589D + L597D, and 425IPG427 ⟶ AAA + W589D + L597D), co-expressed in HeLa cells with Myc-MIRO1 and Mito-DsRed2. Scale bars represent 15 μm. b, d Mitochondrial-to-cytoplasmic intensity ratios of Halo-tagged TRAK11-640 WT and the mutants shown in (a, c). Data points are color-coded by experimental replicate (N = 3 biological replicates, n = 10 cells), with average values outlined in black. The center line and bars represent the mean ± SD of the three biological replicates. Statistical significance was determined using a right-tailed one-way ANOVA with Tukey’s multiple comparisons test. P-values: b (WT vs W589D p = 0.0696, WT vs L597D p = 0.8494, WT vs W589D + L597D p = 0.0192, W589D vs L597D p = 0.5728, W589D vs W589D + L597D p = 0.9965, L597D vs W589D + L597D p = 0.2345), d (WT vs 425IPG427⟶AAA p = 0.1111, WT vs W589D + L597D p = 0.0195, WT vs 425IPG427⟶AAA + W589D + L597D p = 0.0112, 425IPG427⟶AAA vs W589D + L597D p < 0.0001, 425IPG427⟶AAA vs 425IPG427⟶AAA + W589D + L597D p < 0.0001, W589D + L597D vs 425IPG427⟶AAA + W589D + L597D p > 0.9999). P-values are also indicated in the figures, with ns for p > 0.05. All data points and statistical tests are provided in the Source Data file.
Fig. 7
Fig. 7. Model of MIRO1-mediated TRAK1 recruitment to mitochondria.
The MIRO1-TRAK1 complex forms a dimer at the outer mitochondrial membrane, with the dimerization interface involving MIRO1’s ELM2-cGTPase and TRAK1. TRAK1 Site-1 (I425-S428) and Site-2 (L570-R613) bind at the interface of MIRO1’s ELM2-cGTPase and nGTPase-ELM1, respectively. In vitro, both interactions are independent of cofactor conditions (Ca2+ or nucleotide), though their regulation in cells may involve other factors, such as microtubule-based motors and/or MIRO1 clustering on the mitochondrial membrane.

References

    1. Fransson, A., Ruusala, A. & Aspenstrom, P. Atypical Rho GTPases have roles in mitochondrial homeostasis and apoptosis. J. Biol. Chem.278, 6495–6502 (2003). - PubMed
    1. Fransson, S., Ruusala, A. & Aspenstrom, P. The atypical Rho GTPases Miro-1 and Miro-2 have essential roles in mitochondrial trafficking. Biochem. Biophys. Res. Commun.344, 500–510 (2006). - PubMed
    1. Weihofen, A., Thomas, K. J., Ostaszewski, B. L., Cookson, M. R. & Selkoe, D. J. Pink1 forms a multiprotein complex with Miro and Milton, linking Pink1 function to mitochondrial trafficking. Biochemistry48, 2045–2052 (2009). - PMC - PubMed
    1. Saotome, M. et al. Bidirectional Ca2+-dependent control of mitochondrial dynamics by the Miro GTPase. Proc. Natl. Acad. Sci. USA105, 20728–20733 (2008). - PMC - PubMed
    1. Kanfer, G. et al. Mitotic redistribution of the mitochondrial network by Miro and Cenp-F. Nat. Commun.6, 8015 (2015). - PMC - PubMed

MeSH terms

LinkOut - more resources