. 2025 Jul 4;16(1):6170.
doi: 10.1038/s41467-025-61125-1.

Kitlo hematopoietic stem cells exhibit distinct lymphoid-primed chromatin landscapes that enhance thymic reconstitution

Affiliations

Kitlo hematopoietic stem cells exhibit distinct lymphoid-primed chromatin landscapes that enhance thymic reconstitution

Harold K Elias et al. Nat Commun. .

Abstract

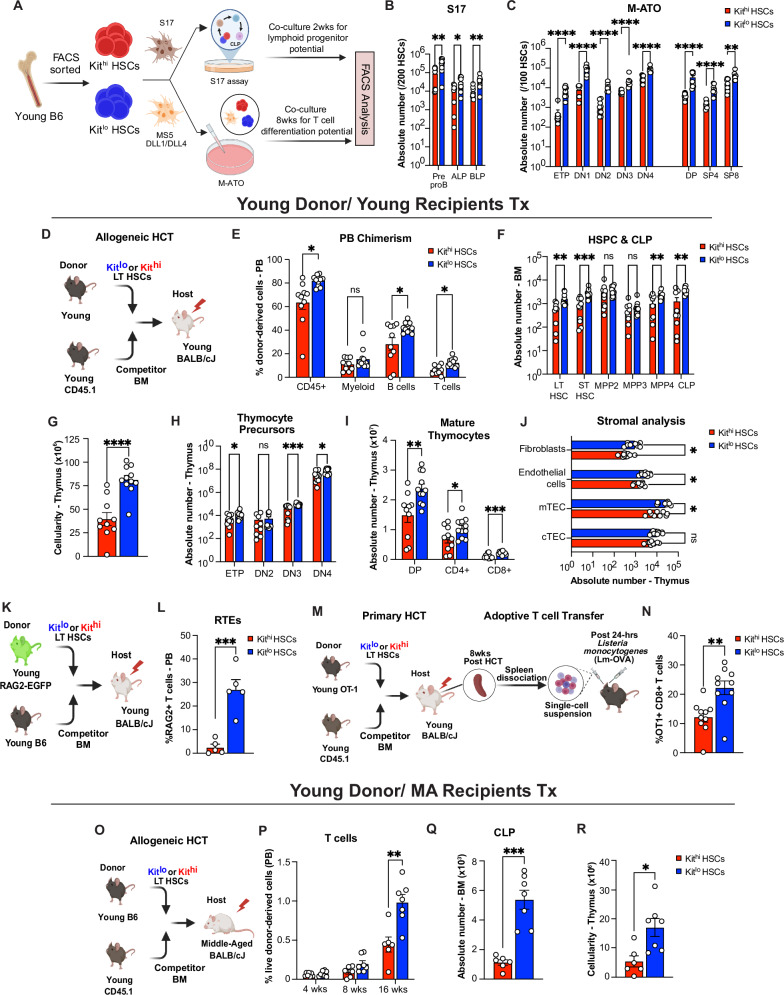
Hematopoietic stem cells (HSC) with multilineage potential are critical for T cell reconstitution after allogeneic hematopoietic cell transplantation (allo-HCT). The Kitlo HSC subset is enriched for multipotential precursors, but their T cell potential remains poorly characterized. Using a preclinical allo-HCT mouse model, we demonstrate that Kitlo HSCs provide superior thymic recovery and T cell reconstitution, resulting in improved immune responses to post-transplant infection. Kitlo HSCs with augmented bone marrow (BM) lymphopoiesis mitigate age-associated thymic alterations and enhance T cell recovery in middle-aged mice. Mechanistically, chromatin profiling reveals Kitlo HSCs exhibiting higher activity of lymphoid-specifying transcription factors, such as, ZBTB1. Zbtb1 deletion diminishes HSC engraftment and T cell potential; by contrast, reinstating Zbtb1 in megakaryocytic-biased Kithi HSCs rescues hematopoietic engraftment and T cell potential in vitro and in vivo. Furthermore, age-associated decline in Kitlo HSCs is associated with diminished T lymphopoietic potential in aged BM precursors; meanwhile, Kitlo HSCs in aged mice maintain enhanced lymphoid potential, but their per-cell capacity is diminished. Lastly, we observe an analogous human BM KITlo HSC subset with enhanced lymphoid potential. Our results thus uncover an age-related epigenetic regulation of lymphoid-competent Kitlo HSCs for T cell reconstitution.


Conflict of interest statement

Competing interests: M.R.M.vdB. has received research support and stock options from Seres Therapeutics and stock options from Notch Therapeutics and Pluto Therapeutics; he has received royalties from Wolters Kluwer; has consulted, received honorarium from or participated in advisory boards for Seres Therapeutics, WindMIL Therapeutics, Rheos Medicines, Merck & Co, Inc., Magenta Therapeutics, Frazier Healthcare Partners, Nektar Therapeutics, Notch Therapeutics, Forty Seven Inc., Priothera, Ceramedix, Lygenesis, Pluto Therapeutics, GlaskoSmithKline, Da Volterra, Vor BioPharma, Novartis (Spouse), Synthekine (Spouse), and Beigene (Spouse); he has IP Licensing with Seres Therapeutics and Juno Therapeutics; and holds a fiduciary role on the Foundation Board of DKMS (a nonprofit organization). The Walter and Eliza Hall Institute of Medical Research receives milestone and royalty payments related to venetoclax. Employees are entitled to receive benefits related to these payments. M.G.K. is a member of the scientific advisory board of 858 Therapeutics, and the laboratory gets research support from AstraZeneca and Transition Bio. The remaining authors declare no competing interests.

Figures

Fig. 1
Fig. 1. Age-related decline in multilineage HSCs marked by low Kit expression.
AH Multiome single-cell RNA and ATAC sequencing was performed on HSC (Lineage-Sca-1+cKit+ CD34-CD48-Flt3-CD150+) cells isolated from 2-mo (young) or 24-mo (old) female C57BL/6 mice. nTOTAL = 12,350 cells. A Volcano plot of DGE analysis between MLin-HSC vs. q-HSC subsets in young HSCs, highlighting bona fide HSC markers. B Violin plot for imputed Kit gene expression by annotated HSC subsets (as described in Fig. S2C). C Frequency of computationally defined HSC subtypes in Kithi and Kitlo subsets in young HSCs. D, E Combined Uniform manifold approximation and projection (UMAP) of young and old HSCs after Harmony batch correction, annotated by age (D) and annotated HSC subsets (q-HSC: Quiescent HSCs; Mgk-HSCs: Platelet-biased HSCs; Mlin-HSC: Multilineage HSCs; p-HSC: Proliferative HSCs; Int-HSC: Intermediate HSCs) (E). F Frequency of HSC subtypes in young and old HSCs. G Heatmap showing MAGIC-imputed gene expression values of bona fide HSC markers ordered by increasing Kit expression. H Violin plot for imputed Kit gene expression by age. Statistical analysis was performed using the Wilcoxon test. I Scaled change in frequency for each Kit HSC subset with age. J FACS analysis showing the frequency of Kithi and Kitlo HSCs by age. All data are from n = 6 mice/group (young = 6; old = 6). Error bars represent mean ± SEM. **P < 0.01, ***P < 0.001. P-values calculated by two-way ANOVA. Source data are provided as a Source Data file, Source Data Fig. 1.
Fig. 2
Fig. 2. Young Kitlo HSCs exhibit enhanced T cell potential.
A Experimental schema to evaluate in vitro lymphoid progenitor and T cell differentiation potential of Kithi (red) and Kitlo HSCs (blue) from 2-mo (young) C57BL/6 mice using the S17 lymphoid assay and murine artificial thymic organoid (M-ATO), respectively. Enumeration of absolute number of lymphoid progenitor cells following 14 days in S17 lymphoid assay (B) and absolute number of T cell subsets following 8 weeks of culture in M-ATOs (C). Refer to Supplementary Fig. 13A, B for gating strategies to define the above populations. Aggregated data across 3 independent experiments, each performed in triplicate (Kitlo = 3; Kithi = 3). D Experimental schema for competitive allogeneic HCT (allo-HCT) using Kithi (red) and Kitlo HSCs (blue) from 2-mo (young) C57BL/6 mice with competitor bone marrow (BM) cells from B6.SJL-PtprcaPepcb/BoyJ mice were transplanted into lethally irradiated 7-week-old (young) BALB/cJ recipients. EJ Eight weeks after competitive HCT, (E) frequency of donor-derived chimerism (CD45.2/ H-2Kb) of mature lineages in the peripheral blood (PB, CD45+, Myeloid cell: Gr-1+CD11b+; B cell: B220+; T cell: CD3 + ), (F) Enumeration of absolute number of donor-derived cells in the BM for LSK cells (LT HSC: LineageSca-1+cKit+ CD34CD48Flt3CD150+; ST HSC: LineageSca-1+cKit+ CD48Flt3CD150; MPP2: LineageSca-1+cKit+ CD48+Flt3CD150; MPP3: LineageSca-1+cKit+ CD48+Flt3CD150+; MPP4/ LMPP: LineageSca-1+cKit+ Flt3+CD150) and Common Lymphoid Progenitors cells (CLP: LineageIL7Ra+Flt3+Scamid/lo Kitlo). GJ Post-HCT thymi analysis for total thymic cellularity (G), H, I enumeration of absolute number of donor-derived cells for T cell precursors (ETP: Lineage CD4 CD8CD44+ CD25Kit+; DN2: Lineage CD4 CD8CD44+ CD25+; DN3: Lineage CD4 CD8CD44 CD25+) (H), Mature T cells (DP: Lineage CD4+ CD8+; SP4: Lineage CD4+ CD8; SP8: Lineage CD4 CD8+) (I), and analysis of thymic CD45- compartment for Thymic Epithelial Cells (TEC: CD45 EpCAM+), Cortical TEC (cTEC: CD45 EpCAM+UEA-1lo 6C3hi MHCIIhi/lo), Medullary TEC (mTEC: CD45 EpCAM+UEA-1hi 6C3lo MHCIIhi/lo), endothelial cells: CD45 EpCAMTer119 PDGFRα CD31+ and fibroblasts: CD45 EpCAMTer119CD31 PDGFRα+) (J). Data for (EI) are from n = 10–11 mice/group (Kithi = 10; Kitlo = 11) and (J) from 9 mice/group (Kithi = 9; Kitlo = 9), across two independent experiments. K Experimental schema to evaluate thymic function following competitive allo-HCT using young HSCs. L Frequency of donor-derived Recent Thymic Emigrants (RTE: CD3 + GFP + ) in the PB at 8 weeks post-HCT. Refer to Supplementary Fig. 13C for the gating strategy to define the above population. All data are from n = 5 mice/group (Kitlo = 5; Kithi = 5). M Experimental schema to investigate the functional response of differential Kit-expressing HSC-derived T cells in secondary recipients to L. monocytogenes expressing chicken ovalbumin (LM-OVA) infection. N Spleen analysis of secondary recipients for frequency of OT1-derived chimerism of CD8+ T cells (OT1+CD8 + : CD45.1+H2-KbCD8+) 7 days post-infection. Refer to Supplementary Fig. 13D for the gating strategy to define the above population. All data are from n = 10 mice/group, (Kitlo = 10; Kithi = 10), across two independent experiments. O Experimental schema for competitive allogeneic HCT (allo-HCT) using Kithi (red) and Kitlo HSCs (blue) from 2-mo (young) C57BL/6 mice with competitor bone marrow (BM) cells from B6.SJL-PtprcaPepcb/BoyJ mice transplanted into lethally irradiated 14-mo (Middle-aged) BALB/cJ recipients. P Frequency of donor-derived T cell chimerism at the indicated timepoints. Q, R Sixteen weeks after competitive HCT, enumeration of donor-derived CLPs (Q) and total thymic cellularity (R). Data for (PR) are from n = 6–7 mice/group, (Kitlo = 7; Kithi = 6), across two independent experiments. Refer to Supplementary Fig. 12 for gating strategies to define the above populations. Error bars represent mean ± SEM. *P < 0.05, **P < 0.01, ***P < 0.001, ****P < 0.0001. P-values calculated by a nonparametric unpaired two-tailed Mann–Whitney U test. Panels A, D, K, M, and O were created in BioRender. Lab, K. (2025) https://BioRender.com/fl4hwgnand https://BioRender.com/oeh4i7x. Source data are provided as a Source Data file, Source Data Fig. 2.
Fig. 3
Fig. 3. Kitlo HSCs exhibit distinct epigenetic features that facilitate lymphoid potential.
A UMAP of 6 unsupervised HSC clusters identified by tile-based scATAC-seq analysis after Harmony batch correction. BD Annotated by age (B), HSC subsets (C), and Kit subsets (D) on the scATAC-seq UMAP. E scATAC-seq cluster composition by HSC subsets (left) and Kit subsets (right). Color scale denotes correlation values between the ATAC clusters and cell annotations, generated using ArchR. F, G Matrix plots showing motif enrichment identified by ChromVAR (F) and gene accessibility (G) for lymphoid-specifying transcription factors for Kit subsets in young and old HSCs. Z-scores denote chromVAR motif enrichment in (F) and gene accessibility scores (peak matrix values) that have been row-scaled in (G), generated using ArchR.
Fig. 4
Fig. 4. ZBTB1 regulates HSC multipotency and drives thymic reconstitution potential.
A Experimental schema for T cell differentiation assay and competitive allogeneic HCT with Zbtb1-deficient Kitlo HSCs generated with 2-mo young Rosa26Cas9-eGFP KI mice. B Frequency of T cell subsets following 6 weeks of culture in M-ATOs. Refer to Supplementary Fig. 13B for gating strategies to define the above populations. Aggregated data across three independent experiments, each performed in duplicates (Control = 3; Zbtb1-KO = 3). CE Competitive allogeneic HCT with Zbtb1-deficient Kitlo HSCs generated with 2-mo young Rosa26Cas9-eGFP KI mice. Sixteen weeks after competitive HCT, frequency of donor-derived chimerism of mature lineages in the peripheral blood as described in Fig. 2E (C), donor-derived chimerism of LSK and MP cell subsets in the BM (D), and donor-derived chimerism of T cell precursor thymocyte and mature T cell subsets in the thymus (E). All data are from n = 6 mice/group, (Control = 6; Zbtb1-KO = 6), across two independent experiments. F Experimental schema for T cell differentiation assay and competitive allogeneic HCT with Zbtb1-OE Kithi HSCs from young mice. G Frequency of T cell subsets following 6 weeks of culture in M-ATO of young Kithi HSCs. Refer to Supplementary Fig. 13B for gating strategies to define the above populations. Aggregated data across three independent experiments, each performed in duplicates (Control = 3; Zbtb1-OE = 3). HJ Competitive allogeneic HCT with Zbtb1-OE Kithi HSCs generated with young mice. Sixteen weeks after competitive HCT, frequency of donor-derived chimerism of mature lineages in the peripheral blood as described in Fig. 2E (H), donor-derived chimerism of LSK and MP cell subsets in the BM (I), and donor-derived chimerism of T cell precursor thymocyte and mature T cell subsets in the thymus (J). All data are from n = 6 mice/group, (Control = 6; Zbtb1-OE = 6), across two independent experiments. Refer to Supplementary Fig. 12 for gating strategies to define the above populations. K Previously identified Zbtb1 targets and Notch1-interacting proteins enriched in Kitlo HSCs. L Pathway enrichment analysis for non-Notch1 Zbtb1 targets enriched in Kitlo HSCs by gseapy() using GO_Biological_Process_2023 libraries. Bubble plot showing representative pathways. Error bars represent mean ± SEM. *P < 0.05, **P < 0.01, ***P < 0.001. P-values calculated by nonparametric unpaired two-tailed Mann–Whitney U test. Panels (A) and (F) were created in BioRender. Lab, K. (2025) https://BioRender.com/zy2p156. Source data are provided as a Source Data file, Source Data Fig. 4.
Fig. 5
Fig. 5. Old Kitlo HSCs exhibit enhanced T cell potential.
A, B Evaluation of in vitro lymphoid progenitor and T cell differentiation potential of Kithi (red) and Kitlo HSCs (blue) from or 24-mo (old) C57BL/6 mice using the S17 lymphoid assay and murine artificial thymic organoid (M-ATO), respectively, as shown in Fig. 2A. Enumeration of absolute number of lymphoid progenitor cells following 14 days in S17 lymphoid assay (A) and absolute number of T cell subsets following 8 weeks of culture in M-ATOs (B). Refer to Supplementary Fig. 13A, B for gating strategies to define the above populations. Aggregated data across 3 independent experiments, each performed in triplicate (Kitlo = 3; Kithi = 3). C Experimental schema for competitive allogeneic HCT (allo-HCT) using Kithi (red) and Kitlo (blue) HSCs from 22–24-mo (old) C57BL/6 mice with competitor bone marrow (BM) cells from B6.SJL-PtprcaPepcb/BoyJ mice transplanted into lethally irradiated young BALB/cJ recipients. DH Eight weeks after competitive HCT, enumeration of absolute number of donor-derived T cells in the PB (Kithi = 9; Kitlo = 9) (D), LSK cell subsets and CLP cells (Kithi = 10; Kitlo = 10) (E), total thymic cellularity (Kithi = 9; Kitlo = 9). F Donor-derived T cell precursor thymocyte subsets (Kithi = 9; Kitlo = 9) (G), stromal subsets within thymic CD45-compartment (Kithi = 9; Kitlo = 9) (H). Aggregated data across two independent experiments. I Experimental schema to evaluate thymic function following competitive allo-HCT using old HSCs. J Frequency of donor-derived Recent Thymic Emigrants (RTE: CD3+GFP+) in the PB at 8 weeks post-HCT. Refer to Supplementary Fig. 13C for the gating strategy to define the above population. All data are from n = 5 mice/group (Kitlo = 5; Kithi = 5). K Experimental schema for competitive allogeneic HCT (allo-HCT) using Kithi (red) and Kitlo HSCs (blue) from 22–24-mo (old) C57BL/6 mice with competitor bone marrow (BM) cells from B6.SJL-PtprcaPepcb/BoyJ mice transplanted into lethally irradiated middle-aged BALB/cJ recipients. LN Eight weeks after competitive HCT, enumeration of the absolute number of donor-derived T cells in PB (L), donor-derived CLPs in the BM as defined in Fig. 3D (M), and thymic cellularity (N). All data are from n = 5 mice/group (Kitlo = 5; Kithi = 5). Refer to Supplementary Fig. 12 for gating strategies to define the above populations. O Frequency of T cell subsets following 6 weeks of culture in M-ATO of old Kithi HSCs following Zbtb1 OE. Refer to Supplementary Fig. 13B for gating strategies to define the above populations. Aggregated data across three independent experiments, each performed in duplicates (Control = 3; Zbtb1-OE = 3). Error bars represent mean ± SEM. *P < 0.05, **P < 0.01, ***P < 0.001, ****P < 0.0001. P-values calculated by a nonparametric unpaired two-tailed Mann–Whitney U test. Panels (C), (I), and (K) were created in BioRender. Lab, K. (2025) https://BioRender.com/oeh4i7x. Source data are provided as a Source Data file, Source Data Fig. 5.
Fig. 6
Fig. 6. KITlo human BM HSCs exhibit enhanced lymphoid potential.
AE Young and old human BM CITE-seq dataset generated and published by Sommarin et al. AC UMAP of CD34+ young and old human BM annotated with HSC subsets (A), and age (B, C) HSC cluster composition by age. D Kitlo gene signature (top 50 marker genes from 239 mouse genes identified with human orthologues) was overlaid on human HSC UMAP. E Violin plot for Kitlo gene score by age. Statistical analysis was performed using the Wilcoxon test. F, G FACS analysis of human BM samples. F Violin plot of KIT protein expression on phenotypic HSCs (p-HSC: CD34 + CD38-CD10-CD45RA-CD90 + ) by age (young: 20–40 yrs; MA/old: >40 yrs). G Scatterplot showing distribution of KIThi and KITlo HSC subsets within p-HSCs in human BM samples with varying age. The two-tailed P-values generated for (G) were based on a single multivariable generalized estimating equation (GEE) logistic model. The model was adjusted for age, KITlo and KIThi groups, and their interaction, with an exchangeable working correlation structure to account for the matched data structure. H Experimental schema to evaluate in vitro T cell and lympho-myeloid potential of human BM HSC subsets based on differential KIT expression using human artificial thymic organoids (H-ATO) and MS5 assay, respectively. I Following 8–10-weeks of culture, enumeration of CD19+ B cells and T cell subsets within CD34+ T cell precursors (Early Thymic Progenitors, ETP: CD34+CD1aCD7; CD1aneg- ProT: CD34+CD1aCD7+; CD1apos-ProT: CD34+CD1a+CD7+), and mature T cells (DP: CD34CD5+CD7+CD4+CD8+; SP4: CD34CD5+CD7+CD4+CD8; SP8: CD34CD5+CD7+CD4CD8+). Refer to Supplementary Fig. 10E for gating strategies to define the above populations. Aggregated data from 8 independent BM donors, each performed in duplicates, across two independent experiments (KITlo = 8; KIThi = 8). J Following 4 weeks of culture, enumeration of Lineage output (Neutrophil-Granulocytes: hCD45+CD15+; monocyte-macrophages: hCD45+CD14+; B cells: hCD45+CD19+; NK cells: hCD45+CD56+) after culturing 200 KITlo and KIThi HSCs.79Aggregated data from 5 independent BM donors, each performed in triplicate or triplicates, across two independent experiments (KITlo = 5; KIThi = 5). Refer to Supplementary Fig. 10F for gating strategies to define the above populations. K Our model illustrates that hematopoietic stem cells (HSCs) with distinct lymphoid-primed chromatin states and differential ZBTB1 activity, which determines their lymphoid potential, can be distinguished by their CD117/KIT expression. In young bone marrow, Kitlo HSCs (blue) with high ZBTB1 activity exhibit enhanced lymphoid potential, thymic recovery, and T-cell reconstitution, in contrast to Kithi HSCs (red) with reduced lymphoid potential. The age-related decline in lymphoid potential results from both a proportional shift toward Kithi HSCs and a global decrease in ZBTB1 activity across all HSC populations. Error bars represent mean ± SEM. *P < 0.05, **P < 0.01, ***P < 0.001, ****P < 0.0001. P-values calculated either by nonparametric paired two-tailed Mann–Whitney U test (I and J), unpaired Mann–Whitney U test (F). Panels (H) and (K) were created in BioRender. Lab, K. (2025) https://BioRender.com/fl4hwgn. Source data are provided as a Source Data file, Source Data Fig. 6.

References

    1. Hale, J. S., Boursalian, T. E., Turk, G. L. & Fink, P. J. Thymic output in aged mice. Proc. Natl. Acad. Sci. USA103, 8447–8452 (2006). - PMC - PubMed
    1. Britanova, O. V. et al. Age-related decrease in TCR repertoire diversity measured with deep and normalized sequence profiling. J. Immunol.192, 2689–2698 (2014). - PubMed
    1. Linton, P. J. & Dorshkind, K. Age-related changes in lymphocyte development and function. Nat. Immunol.5, 133–139 (2004). - PubMed
    1. Naylor, K. et al. The influence of age on T cell generation and TCR diversity. J. Immunol.174, 7446–7452 (2005). - PubMed
    1. Nikolich-Zugich, J. T cell aging: naive but not young. J. Exp. Med.201, 837–840 (2005). - PMC - PubMed

LinkOut - more resources