. 2025 Jul 4;16(1):6168.
doi: 10.1038/s41467-025-60971-3.

Cx43 enhances response to BRAF/MEK inhibitors by reducing DNA repair capacity

Affiliations

Cx43 enhances response to BRAF/MEK inhibitors by reducing DNA repair capacity

Adrián Varela-Vázquez et al. Nat Commun. .

Abstract

BRAF and MEK inhibitors (BRAF/MEKi) have radically changed the treatment landscape of advanced BRAF mutation-positive tumours. However, limited efficacy and emergence of drug resistance are major barriers for successful treatments. Here, by using relevant preclinical models, we find that Connexin43 (Cx43), a protein that plays a role in cell-to-cell communication, enhances the effectiveness of BRAF/MEKi by recruiting DNA repair complexes to lamin-associated domains and promoting persistent DNA damage and cellular senescence. The nuclear compartmentalization promoted by Cx43 contributes to genome instability and synthetic lethality caused by excessive DNA damage, which could provide a therapeutic approach for these tumours to overcome drug resistance. Based on these findings, we designed a drug combination using small extracellular vesicles (sEVs) to deliver the full-Cx43 in combination with the BRAF/MEKi. This study reveals Cx43 as a regulator of DNA repair and BRAF/MEKi response, highlighting the therapeutic potential that this approach could eventually have in the clinic to overcome the limitations of current therapies and improve treatment outcomes for patients with advanced BRAF mutant tumours.


Conflict of interest statement

Competing interests: The authors declare no competing interests.

Figures
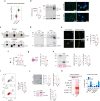
Fig. 1
Fig. 1. Overexpression of Cx43 decreases proliferation and increases senescence in BRAF and NRAS cancer cells.
a GJA1 gene expression was analysed across tumour samples and paired normal tissues using SKMC data from the Broad Institute and GEPIA. Expression values were plotted as −log2(TPM + 1). b Cx43 expression in A375 cells (WT, empty vector control (C), and Cx43-overexpressing (Cx43)) was confirmed by qPCR (n = 7), western blot, and immunostaining. White arrows indicate membrane localisation. Western blot identified non-phosphorylated (P0) and phosphorylated isoforms (P1, P2), with tubulin as loading control. c Immunoprecipitation and immunoblotting showed Cx43 and SUMO2 interaction in A375, BLM and A451 cells. d Cx43 localisation was examined in total cell lysate (CL), soluble (Sol), and insoluble (Ins) fractions (20 µg each) from A375 and A375-Cx43 cells. Tubulin was used as a control. e Dye transfer and scrape loading assays (n = 6) showed significantly increased intercellular communication in A375-Cx43 cells (p = 0.0004). f ATP release was measured in A375-C and A375-Cx43 cells under basal conditions and after treatment with 100 µM carbenoxolone (CBX) (n = 4–5, p < 0.0001). g Colony formation was reduced in A375-Cx43 cells after 7 days (n = 3, 5 replicates, p = 0.0345). h Western blot of pRB and Cx43 in A375-C and A375-Cx43 cells showed significant changes (n = 3, p = 0.0062 for pRB; p = 0.0052 for Cx43). Ponceau was used for normalisation. i Cell cycle analysis (n = 3, 2 replicates) showed reduced S phase in A375-Cx43 cells (p = 0.0011). j SAß-Galactosidase staining and quantification showed increased senescence in A375-Cx43 cells (n = 4, p = 0.00345), confirmed by flow cytometry (n = 5, p = 0.00286). Western blot for p21 (n = 3) also showed upregulation. k Heatmap of colony formation in BRAF/NRAS mutant cell lines showed significant reductions with Cx43 overexpression (p = 0.0043; 0.0238; 0.035; 0.100; 0.016; 0.00238). SAß-Galactosidase quantification in these lines (n = 3) also indicated increased senescence (p = 0.0034; 0.085; 0.00089; 0.0041; 0.02; 0.0025). Source data are provided as a Source Data file. Two-tailed Student’s t test or Mann-Whitney tests were used; data are mean ± SEM (*p < 0.05, **p < 0.01, ***p < 0.001).
Fig. 2
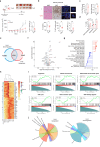
Fig. 2. Cx43 enhances senescence, cell death and DNA damage response in BRAF cancer cells.
a Schematic workflow and images of the tumours. Created in BioRender. Varela Vázquez, A. (2025) https://BioRender.com/2yiuegc. Tumour growth of A375-C and A375-Cx43 xenografts in nude mice (p = 0.0079; 0,0115). Tumour weight at endpoint (n = 5 mice/group) is shown on the right (p = 0.0052). b Immunostaining and quantification of Cx43 (p<0.0001) and Ki67 (p < 0.0001) in all tumours. Haematoxylin and eosin (H&E) staining was used to assess cellularity (p = 0.0151). Data are expressed as MFI (arbitrary units, a.u.) (n = 5 mice/group). Scale bars: 100 µm (H&E, Ki67), 20 µm (Cx43, DAPI). c Cx43 and CASP3 mRNA levels from endpoint tumours. (n = 4–5) (p = 0.0036; 0.0317) (d) Percentage of necrotic and apoptotic cells in A375-C and A375-Cx43 cells by flow cytometry using double staining (PI/YO-PRO) (n = 3) (p = 0.9205; 0.0043; 0.013). e RNA-seq analysis of four replicates each of A375-C and A375-Cx43 cells. The Venn diagram shows differentially and commonly expressed proteins. f Volcano plot illustrating transcriptomic differences between A375-C and A375-Cx43 cells (LFC ≥ 1 or ≤ −1; log10(p-value) <0.05). Signature proteins overexpressed in A375-C are in blue, those in A375-Cx43 in red. See Supplementary Data 1 for details. g Pathway analysis of differentially expressed proteins was conducted using KEGG and Reactome (uppercase). The size of the circles represents the number of genes in the Leading Edge Number. Positive enrichment scores (ES) (red) indicate overexpressed pathways in A375-Cx43, while negative ES (blue) indicate downregulated pathways in A375 Cx43. Statistical significance was determined by Benjamini-Hochberg FDR adjusted p < 0.05. h Heatmap comparing DEGs between A375-C and A375-Cx43. Only genes with adjusted p < 0.05 and |LFC| ≥ 1 were included. i GSEA revealed positive enrichment of apoptosis, senescence, and double-strand break repair, and negative enrichment of cell cycle, base excision repair, and DNA damage bypass in A375-Cx43. j Chord diagrams represent gene-pathway associations for up- and downregulated pathways in A375-Cx43. Pathway significance was based on LFC of constituent genes (adjusted p < 0.05 and |LFC| ≥ 1). Cumulative pathway value = sum of gene LFCs. Source data are provided as a Source Data file. Two-tailed Student´s t test were used to calculate the significance represented as followed: ns no significant, *p < 0.05, **p < 0.01. ***p < 0.001. Data is presented as mean ± SEM.
Fig. 3
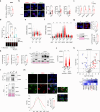
Fig. 3. Cx43 interacts with the nuclear lamin and interferes with the DNA damage response in BRAFV600E mutant tumours.
a Cytoplasmic ROS levels were significantly higher in A375-Cx43 compared to A375-C cells, shown as RFU (Ex/Em = 485/535 nm) (n = 5; p = 0.014). b Nuclear DNA damage markers (53BP1, pATM, γ-H2AX) were elevated in A375-Cx43 vs. A375-C cells, with representative images and quantification (n = 3; p = 0.0004, 0.0002, 0.0026). c RNA expression levels of DNA repair genes ATM, ERCC1, XRCC2, and uPAR were significantly altered in A375-Cx43 cells (n = 4; p = 0.011, 0.0001, 0.0002, 0.022). d Comet assays revealed increased DNA damage in A375-Cx43. Positive controls were cells treated with 5 µM bleomycin (BLEO) for 72 h; DNA repair capacity was evaluated 72 h post-bleomycin removal. Tail moment quantified with OpenComet (n = 3). e γ-H2AX fluorescence intensity per cell was quantified in MCF7-C and MCF7-Cx43 cells by cell cycle phase (EdU incorporation, DAPI intensity), using a pre-extraction step (n = 3). f After 2 h treatments with genotoxic agents (3 mM HU, 1 µM CPT, 25 µg/mL BLEO, 25 µg/mL APH, 25 µM MMC), MCF7-Cx43 showed elevated γ-H2AX signal (n = 3; p = 0.046, <0.0001, <0.0001, <0.0001, <0.0001, 0.0046). g Immunofluorescence and western blot showed enhanced cytochrome c release in A375-Cx43 (n = 3; p < 0.0001); Ponceau was used as loading control. h Cx43, CASP3, and ATM mRNA levels were assessed in untreated mouse-derived tumours (p = 0.0036, 0.0159). (i) Cx43 protein was detected in enriched nuclear and cytoplasmic fractions of A375-C and A375-Cx43 cells. Lamin A and tubulin served as controls (n = 3). j Cx43 nuclear intensity in MCF7-C and MCF7-Cx43 was evaluated in chromatin-bound (pre-extracted) and total nuclear fractions (n = 3). k Cx43 IP from nuclear fractions of A375-C and A375-Cx43 revealed differential enrichment by mass spectrometry. Volcano plot and heatmap show DNA repair protein enrichment. l Cx43 nuclear IPs were validated by western blot. IgG served as a negative control. m Confocal imaging showed Cx43 colocalization with Lamin A/C in A375 cells. Pearson’s coefficient quantified overlap (n = 3). Source data are provided as a Source Data file. Data: mean ± SEM. Tests: two-tailed Student’s t test or one-way ANOVA (*p < 0.05, **p < 0.01, ***p < 0.0001).
Fig. 4
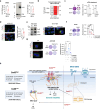
Fig. 4. Cx43 enhances the response to BRAF/MEK inhibitors treatments and overcomes drug resistance.
a Comet assay was performed to assess DNA damage in control and Cx43-overexpressing cells treated with 1 nM T and 100 nM D for 72 h. Tail moment was quantified using the OpenComet plug-in in ImageJ, with manually excluded misidentified comets. (n = 3) (p = 0.0007; <0.0001; <0.0001) (b) Representative nuclei images showing 53BP1 (p = 0.0003; 0.0001; 0.0197; <0.0001) and pATM (p = 0.09; 0.011; <0.0001; <0.0001) foci in C and Cx43 overexpressing A375 cells. An increment on the number of foci per cell is observed in Cx43 overexpressing cells in combination with BRAF/MEKi. (n = 3 independent experiments). c Colony formation analysis of A375 transfected with an C of Cx43 and treated with BRAF/MEKi. A significant cytotoxicity in the A375-Cx43 cell line (Dabrafenib IC50 = 0.7782 nM and Trametinib IC50 = 0.0803 nM) was detected compared to A375-C (dabrafenib IC50 = 2.301 and trametinib IC50 = 0.2577 nM). d Cell death measured by flow cytometry showing A375-EV and Cx43 cells undergoing early apoptosis, apoptosis and necrosis. Quantification of n = 3 experiments is showed on the right. e Colony formation assays of A375-C and Cx43 cells after 1 week, 2 week and 4 months under 1 nM T and 100 nM D treatments. Data is representative of n = 3 independent experiments. (p = 0.046; 0.0006; <0.0001) (f) Flow cytometry analysis showing A375 DR cells transfected with Cx43 and its empty vector counterpart, undergoing early apoptosis, apoptosis and necrosis. (n = 3) (p = 0.0005; 0.0081; 0.0068) (g) Heat map and flow cytometry analysis of HCC364 DR cells (DTEP, EGFR, NRAS) transfected with Cx43 or empty vector, showing apoptosis profiles (n = 3). Cells were double-stained with PI (2 µg/mL) and YO-PRO−1 (150 nM); live cells (PI-/YO-PRO−1-) were gated based on FSC/SSC to exclude debris, and singlets were selected via FSC-H/FSC-A. The right panel shows gating and quantification of early apoptosis, apoptosis, and necrosis in Cx43 and control cells (n = 3). (p = 0.0019) (p = 0.00037; 0.00095; 0.014) Source data are provided as a Source Data file. Data are expressed as mean ± SEM. Two-tailed Student’s t test and one-way ANOVA were used to calculate significance as follows: *P < 0.05, **P < 0.01, ***P < 0.0001.
Fig. 5
Fig. 5. RNA-Seq analysis of gene signature in sensitive cells after combined Cx43 and BRAF/MEKi treatments.
a Volcano plot showing differentially regulated transcriptomics comparing control and Cx43 overexpressing A375 cells under BRAF/MEKi treatment (sensitive cells) (LFC ≥ 1 and ≤ −1; log10pvalue < 0.05). Signature proteins overexpressed in A375 C D/T are shown in blue and signature proteins overexpressed in A375 Cx43 D/T are shown in red. b Heatmap showing differentially expressed proteins (DEGs) comparing A375 C and Cx43 treated with BRAF/MEKi. DEGs were ranked based on their LFC. DEGs were included if adjusted p < 0.05 and |LFC| ≥ 1. c GSEA showing positive enrichment of cellular senescence, apoptosis, cell cycle checkpoints, homologous recombination, DNA double-strand breaks and DNA repair signatures in A375-Cx43 D/T cells. d At the top, schematic representation of the workflow performed in the animal model. Created in BioRender. Varela Vázquez, A. (2025) https://BioRender.com/jh1ans2. Middle panel, graph representing the tumour volume at the different stages of the experiment. Bottom, representative images and quantification of the percentage of ulcerated tumours in mice injected with A375 C compared to Cx43 overexpression. (p = 0.015) (e) Hematoxylin-eosin staining (H&E); Ki67 and Cx43 IF in primary tumours from mice injected with A375 C and Cx43 cells after treatment with BRAF/MEKi (TD). Cx43 levels were quantified as mean fluorescence intensity (MFI) and Ki67 as percentage of positive cells. Scale bars: 100 µm (HE, Cx43/DAPI and Ki67) (p = 0.0029; <0.0001) (f) Cx43, CASP3 and ATM mRNA levels in tumour derived mice at endpoint, after 28 days of BRAF/MEKi treatment. All experiments were performed in at least three independent replicates. (p = 0,0123; 0,0081; 0,0078) Source data are provided as a Source Data file. Data are expressed as mean ± SEM. Two-tailed Student’s t test and one-way ANOVA were used to calculate significance as follows: *P < 0.05, **P < 0.01, ***P < 0.0001.
Fig. 6
Fig. 6. The presence of Cx43 in sEVs switches the role of these vesicles promoting the anti-tumour activity.
a Cx43 mRNA and protein levels were evaluated in sEVs from A375-C and A375-Cx43 cells via RT-qPCR and western blot. CD9 served as an sEV marker; tubulin was used as a loading control for cell lysates (n = 3) (p = 0.0089; 0,0137). b A heatmap showed increased Cx43 mRNA and protein levels in A375 cells treated for 5 days with Cx43-positive sEVs (2.22 × 10¹² particles, refreshed every 48 h), compared to untreated controls (n = 3) (p = 0.026). c Colony formation assays revealed reduced clonogenic capacity in A375 and BLM tumour cells treated with either Cx43-sEVs (2.23 × 10¹² particles) or control sEVs (2.36 × 10¹² particles) over 7 days (n = 3) (p = 0.0003; 0.0001). d Vimentin (green) immunofluorescence in A375 cells treated for 2 h with Dil-labelled (red) sEVs confirmed internalisation (n = 3). e Western blot showed Cx43 protein in HEK293-derived cell lysates and sEVs; CD9 and CD63 served as loading controls (n = 3) (p = 0.0034). Vimentin immunofluorescence (green) in A375 and A375 DR cells confirmed uptake of Dil-labelled (red) HEK-derived sEVs after 2 h. f Colony formation assay of A375 cells either untreated (UT) or treated with BRAF/MEKi (0.5 nM T/30 nM D), Cx43-sEVs (9.99 × 10¹¹ particles), or their combination for 7 days (refreshed every 48 h) (n = 3) (p < 0.0001; <0.0001; <0.0001; <0.0001; 0.0059). g A375 DR cells internalised Dil-labelled HEK-derived sEVs (vimentin, left). Colony assays of A375 DR cells treated with BRAF/MEKi (2 nM T/200 nM D), alone or combined with single (9.99 × 10¹¹) or quadruple (39.96 × 10¹¹) doses of Cx43-sEVs over 7 days (refreshed every 48 h) (n = 3) (p = 0.044; 0.0298; 0.0402). h Proposed model: In BRAF-mutant tumour cells, Cx43 interacts with DNA repair proteins, inducing persistent DNA damage. Cx43 modulates nuclear DNA organisation, altering repair pathway choice. Combined with BRAF/MEKi, Cx43 induces synthetic lethality by suppressing HR and NHEJ pathways, triggering apoptosis in resistant cells. Created in BioRender. Mayan, M. (2025) https://BioRender.com/3rwzow8. Source data are provided as a Source Data file. Data shown as mean ± SEM. Significance: *P < 0.05, **P < 0.01, ***P < 0.0001.

References

    1. Davies, H. et al. Mutations of the BRAF gene in human cancer. Nature417, 949–954 (2002). - PubMed
    1. Santarpia, L., Lippman, S. M. & El-Naggar, A. K. Targeting the MAPK-RAS-RAF signaling pathway in cancer therapy. Expert Opin. Ther. Targets16, 103–119 (2012). - PMC - PubMed
    1. Malumbres, M. & Barbacid, M. RAS oncogenes: the first 30 years. Nat. Rev. Cancer3, 459–465 (2003). - PubMed
    1. Muzumdar, M. D. et al. Survival of pancreatic cancer cells lacking KRAS function. Nat. Commun.8, 1090 (2017). - PMC - PubMed
    1. Patnaik, M. M. The importance of FLT3 mutational analysis in acute myeloid leukemia. Leuk. Lymphoma59, 2273–2286 (2018). - PubMed

MeSH terms

LinkOut - more resources