. 2025 Jul 4;16(1):6197.
doi: 10.1038/s41467-025-61528-0.

A plant bunyaviral protein disrupts SERRATE phase separation to modulate microRNA biogenesis during viral pathogenesis

Affiliations

A plant bunyaviral protein disrupts SERRATE phase separation to modulate microRNA biogenesis during viral pathogenesis

Jing Zou et al. Nat Commun. .

Abstract

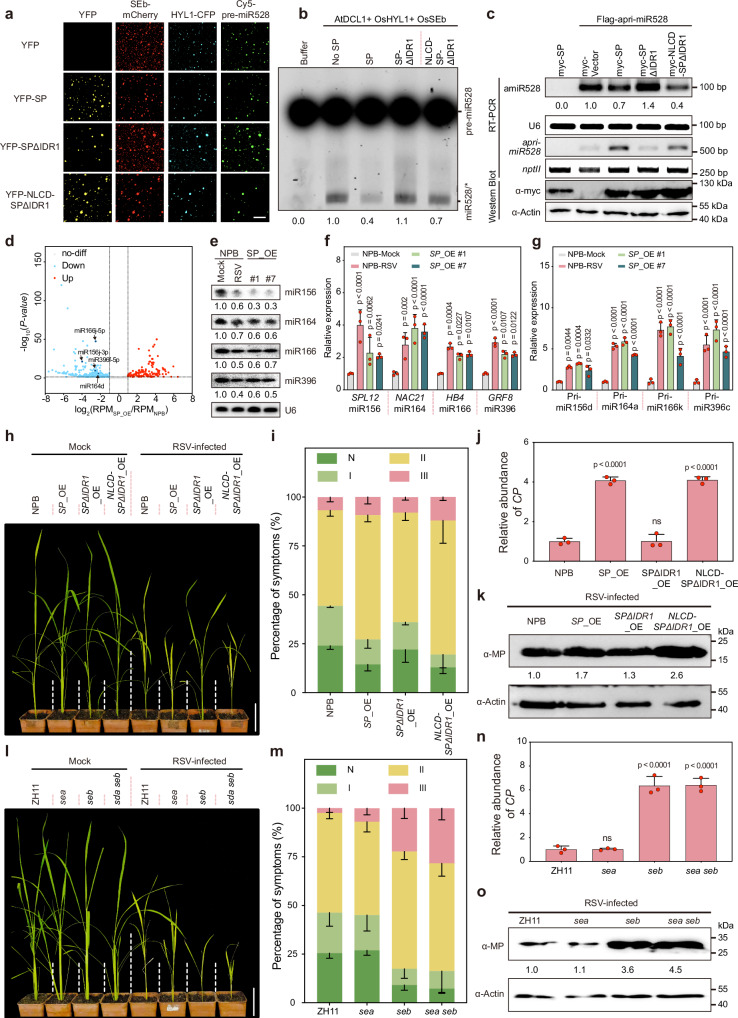
Liquid-liquid phase separation (LLPS) regulates diverse biological functions by mediating the assembly of biomolecular condensates. However, it remains unclear how host LLPS is targeted by viruses during infection. Here we show that a plant bunyaviral protein, the disease-specific protein (SP) encoded by rice stripe virus (RSV), possesses phase separation potential through its N-terminal intrinsically disordered region 1 (IDR1). In vivo, however, SP does not form phase-separated biomolecular condensates independently but utilizes its phase separation properties to interfere with the phase separation of the SERRATE protein (SE), a key component of Dicing bodies essential for microRNA processing. By disrupting SE phase separation, SP inhibits D-body assembly and miRNA biogenesis. Our study demonstrates that a viral protein can modulate host microRNA processing by targeting LLPS, revealing a previously uncharacterized mechanism involved in viral infection strategies and miRNA biogenesis regulation in plants.


Conflict of interest statement

Competing interests: The authors declare no competing interests.

Figures

Fig. 1
Fig. 1. SP has the ability to form biomolecular condensates in an IDR1-dependent manner.
a Confocal images of N. benthamiana leaf cells transiently expressing SP–YFP. SP accumulates in both the cytoplasm and nucleus, forming distinct puncta (red arrows, nucleus; white arrows, cytoplasmic condensates). mSV40-mCherry marks nuclei. Scale bars, 50 μm. b Time-lapse confocal images show dynamic SP–YFP puncta that rapidly move and fuse. Scale bar, 50 μm. c PONDR prediction highlights two short N-terminal IDRs (IDR1 and IDR2, blue/pink bars). d Images of liquid-like droplets formed by Trigger Factor (TF)-YFP-SP (YFP–SP) protein in 10% PEG3350 (PEG). Scale bars, 50 μm. e In vitro droplet assembly shows increasing NaCl reduces YFP–SP droplet formation. Scale bar, 50 μm. f Quantification of turbidity from (e), reflecting decreased LLPS with rising NaCl concentrations. g, h FRAP assays in N. benthamiana leaves expressing SP–YFP. g Pre-bleach and post-bleach images in the cytoplasm (white arrows) and nucleus (red arrowheads). h Recovery curves showing faster fluorescence recovery in cytoplasmic puncta (green trace) than in nuclear puncta (red trace). The bleaching laser intensity was set at 50%, and the excitation wavelength was 488 nm. Scale bar, 10 μm. i Western blot analysis of total protein extracts from wild-type NPB (mock), RSV-infected NPB, and SP-overexpressing (SP_OE) lines. j Immunofluorescence images revealing nuclear SP puncta (red) in RSV-infected rice roots and SP_OE lines. Merged images of DAPI (blue) and anti-SP (red) signals. Scale bar, 2.5 μm. k Representative confocal images of in vitro–reconstituted droplets formed by wild-type and mutant SP proteins. Scale bar, 50 μm. l Turbidity measurements quantifying droplet formation by each construct in (m). All experiments were independently repeated three times with similar results (a, b, d, e, g, ik). Data represent the mean ± SD (n = 3 biological replicates) (f, h, l). Statistical analysis was performed using a two-sided unpaired Student’s t test without adjustment for multiple comparisons. ns, not significant.
Fig. 2
Fig. 2. SP interacts with SE homologs.
a Yeast two-hybrid assay showing SP interacts with SE homologs (SEa, SEb, SEc) but not HYL1 or DCL1 on selective medium lacking leucine, tryptophan, histidine, and adenine (-LTHA). Positive controls: pGBKT7-53/pGADT7-T; negative controls: pGBKT7-Lam/pGADT7-T. b Bimolecular fluorescence complementation (BiFC) assays in N. benthamiana leaves show SP interacting with D-body components in nuclear puncta. Nuclei marked by mSV40-mCherry. Scale bar, 5 μm. c Pull-down assays confirm interactions between His-SP and SE homologs. d Microscale thermophoresis (MST) analysis shows SP binds SEa (Kd: ~ 0.07–0.11 μM), SEb (~ 0.07–0.09 μM), SEc (~0.16–0.21 μM), but not HYL1 or DCL1. Excitation power 8%, MST power 40%, proteins at 20 nM. e Co-IP from RSV-infected rice reveals SP-SEb interaction in vivo, detected by anti-SP and anti-SEb. f BiFC shows SEb-nYFP interacts with SP IDR1 mutants in N. benthamiana (nuclei marked by mSV40-mCherry). Scale bar, 10 μm. g Pull down assays showing the interaction between SEb and SP IDR1 mutations in vitro. h MST compares binding of SEb to SP and SPΔIDR1 variants (Kd: SEb + His-NLCD-SPΔIDR1: ~ 0.02–0.76 μM; SEb + His-SPΔIDR1: ~ 0.06–4.58 μM; SEb + His-SP: ~ 0.02–0.69 μM). Excitation power 60%, MST power 40%, proteins at 50 nM. i Luciferase complementation imaging (LCI) verifying interactions between SEb and either wild-type or mutant SP. j BiFC assay displaying the interactions between SEb and SP mutants (muSP1, muSP2, muSP3). mSV40-mCherry was used as a nuclear localization marker. Scale bar, 10 μm. k Pull down assays showing the interaction between SEb and SP mutants (muSP1, muSP2, muSP3). l The MST curves comparing the binding of SP or SP mutants to SEb. Excitation power 100%, MST power 40%, all labeled proteins were at 5.1 μM. The 95% confidence intervals of the Kd are as follows: SP + SEb: ~0.07–0.15 μM. The experiments were repeated three times with similar results (ac, e, f, g, ik). Data represent the mean ± SD (n  =  3 independent titrations) (d, h, l).
Fig. 3
Fig. 3. SP relies on its IDR1 to inhibit the LLPS of SE.
a Time-lapse confocal images showing pre- and post-photobleaching of YFP-tagged SEa, SEb, and SEc in N. benthamiana leaf epidermal cells at specified time points. Scale bar, 5 μm. b Fluorescence intensity recovery curves comparing SEa–YFP, SEb–YFP, and SEc–YFP recovery after photobleaching. c In vitro droplet formation assay of SEb in the presence of increasing concentrations of SP. Scale bar, 50 μm. d In vitro droplet formation assay of SP in the presence of increasing concentrations of SEb. Scale bar, 50 μm. e Immunostaining in rice lines overexpressing SEb, with or without RSV infection, showing merged signals of DAPI (blue), SEb (red), and SP (yellow). Scale bar, 2.5 μm. f In vitro droplet formation assay of SEb with various SP IDR1 mutants. Scale bar, 50 μm. g Pre- and post-photobleaching time-lapse images of SEb–nYFP co-expressed with SP–cYFP or SP mutants in N. benthamiana cells. Scale bar, 5 μm. h Fluorescence recovery curves comparing different SEb–YFP and SP combinations after photobleaching. The data represent means ± SD in three independent experiments. i Confocal images of rice protoplasts co-transfected with SEb–YFP and mCherry-fused SP constructs at 16 h and 48 h post-transfection. Scale bar, 5 μm. j Bar chart illustrating the average number of nuclear puncta observed under each co-expression condition in (i). The experiments were repeated three times with similar results (a, c, dg, i). Data represent the mean ± SD (n  =  3 biological replicates) (b, h, j). Statistical significance was determined using one-way ANOVA followed by Tukey’s multiple comparisons test (two-sided). Different letters above the bars indicate significant differences at P < 0.05.
Fig. 4
Fig. 4. SP reduces D-body assembly through its IDR1.
a Confocal images of N. benthamiana leaf cells co-expressing SEb–YFP, DCL1–YFP, or HYL1–CFP with SP, SP mutants (muSP1), or control proteins (myc). White arrows indicate punctate structures in the nuclei. White arrows highlight punctate structures in the nuclei. Scale bars, 5 μm. b Quantification of nuclear puncta in (a). Data represent means ± SD (n = 3 biological replicates). Statistical significance was assessed using a two-sided unpaired Student’s t test. c Pull-down experiments using His–SEb, MBP–HYL1, and GST–SP at increasing molar ratios. Input and pull-down samples were analyzed by immunoblotting with anti-His, anti-GST, and anti-MBP antibodies. d MST curves showing binding affinities of SEb and HYL1 in the presence of GST–SP at varying concentrations. Excitation power 60%, MST power 40%, all labeled proteins were at 50 nM. The 95% confidence intervals of the Kd are as follows: HYL1 + His-SEb: ~ 0.15–2.00 μM and HYL1 + His-SEb + GST-SP: ~ 1.92–7.23 μM. e Confocal images of N. benthamiana leaf cells co-expressing SEb–YFP and HYL1–CFP with SP or SP mutants (SPΔIDR1, NLCD-SPΔIDR1). White arrows highlight nuclear puncta. Scale bars, 5 μm. f LCI assay detecting interactions between SEb and HYL1 in N. benthamiana leaves co-expressing SP or its IDR1 mutants (SPΔIDR1, NLCD-SPΔIDR1). g MST binding curves comparing the effects of SP and its variants on the binding affinity between SEb and HYL1. Excitation power 3%, MST power 40%, all labeled proteins were at 1 μM. The 95% confidence intervals of the Kd are as follows: HYL1 + SEb-MBP + His-SP: ~ 2.68–17.65 μM, HYL1 + SEb-MBP + His-NLCD-SPΔIDR1: ~ 4.07–23.63 μM and HYL1 + SEb-MBP + His-SPΔIDR1: ~ 0.92–19.95 μM. h Confocal images showing in vitro droplet formation of fluorescently tagged SEb–mCherry and HYL1–CFP under different co-incubated conditions with SP or its variants (SPΔIDR1, NLCD-SPΔIDR1). Scale bars, 50 μm. The experiments were repeated three times with similar results (a, c, e, f, h). Data represent the mean ± SD (n  =  3 independent titrations) (d, g).
Fig. 5
Fig. 5. SP IDR1 is involved in miRNA processing and viral pathogenicity.
a Confocal images of YFP-SP and its variants co-incubated with SEb–mCherry, HYL1–CFP, and Cy5-labeled pre-miR528. Scale bars, 50 μm. b In vitro cleavage assay showing effects of SP and IDR1 mutants on pre-miRNA processing with purified DCL1, HYL1, and SEb. c RT-PCR and Western blot of N. benthamiana expressing artificial pri-miR528 with SP or its variants. U6 (RT-PCR), nptII (internal RT-PCR), and actin (Western) as loading controls. d Volcano plot of small RNA-seq comparing miRNA expression in SP_OE versus NPB plants. X-axis: log₂ expression ratio; Y-axis: –log₁₀(P-value). Red: upregulated; blue: downregulated miRNAs (P < 0.05). Statistical analysis was performed using a two-sided Wald test without multiple testing correction. e Northern blot detecting miRNAs in NPB, SP_OE and RSV-infected plants. U6 as a loading control. f qRT-PCR showing miRNA (miR156, miR164, miR166, and miR396) and target transcript (SPL12, NAC21, HB4, GRF8) levels in NPB, SP_OE, and RSV-infected plants. g qRT-PCR of pri-miRNAs (pri-miR156d, pri-miR164a, pri-miR166k, pri-miR396c) in indicated plants. h Phenotypes of mock- and RSV-inoculated NPB, SP_OE, SPΔIDR1_OE and NLCD-SPΔIDR1_OE rice lines at 28 dpi. Scale bars, 9 cm. i Percentages of RSV-infected plants with disease grades (N: no symptoms; I: mild symptoms; III: severe symptoms) at 28 dpi for the lines described in (h). j qRT-PCR of RSV CP gene in plants described in (h). k Western blot for RSV MP protein in plants above using an MP-specific antibody. Actin was used as a loading control. l Phenotypes of mock- and RSV-inoculated ZH11 wild-type and sea, seb, or sea/seb mutants at 28 dpi. Scale bars, 9 cm. m Disease grades at 28 dpi in (l). n qRT-PCR of the RSV CP gene in ZH11 wild-type and mutants. o Western blot of RSV MP protein in ZH11 wild-type rice and mutants. Actin as loading control. All experiments repeated three times with similar results (ac, e, h, k, l, o). Data are mean ± SD (n  =  3 independent replicates) (f, g, i, j, m, n). Statistical analysis: two-sided unpaired Student’s ttest. ns, not significant.
Fig. 6
Fig. 6. A model for SP-mediated phase separation’s role in modulating miRNA processing and RSV pathogenesis.
The RSV-encoded SP protein inhibits the phase separation of SE, a core component of the host’s D-body, thereby reducing the assembly and dicing activity of D-body and diminishing miRNA processing and expression.

Similar articles

References

    1. Song, X., Li, Y., Cao, X. & Qi, Y. MicroRNAs and Their regulatory roles in plant–environment interactions. Annu. Rev. Plant Biol.70, 489–525 (2019). - PubMed
    1. Xu, Z.-Y. et al. Plant and animal small RNA communications between cells and organisms. Nat. Rev. Mol. Cell Biol.23, 185–203 (2022). - PMC - PubMed
    1. Sang, Q. et al. MicroRNA156 conditions auxin sensitivity to enable growth plasticity in response to environmental changes in Arabidopsis. Nat. Commun.14, 1449 (2023). - PMC - PubMed
    1. Achkar, N. P., Cambiagno, D. A. & Manavella, P. A. miRNA Biogenesis: A dynamic pathway. Trends Plant Sci.21, 1034–1044 (2016). - PubMed
    1. Ye, J. et al. The ‘how’ and ‘where’ of plant microRNAs. N. Phytol.216, 1002–1017 (2017). - PMC - PubMed

MeSH terms

LinkOut - more resources