. 2025 Jul 4;15(1):23965.
doi: 10.1038/s41598-025-08459-4.

Modeling Pseudomonas aeruginosa-Staphylococcus aureus interactions in zebrafish to assess the host inflammatory response upon co-infection

Affiliations

Modeling Pseudomonas aeruginosa-Staphylococcus aureus interactions in zebrafish to assess the host inflammatory response upon co-infection

Floriane Costes et al. Sci Rep. .

Abstract

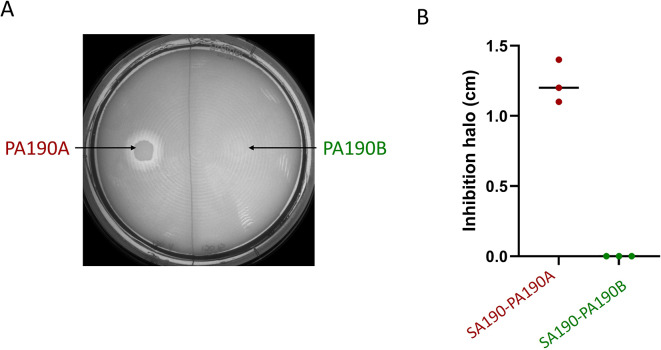
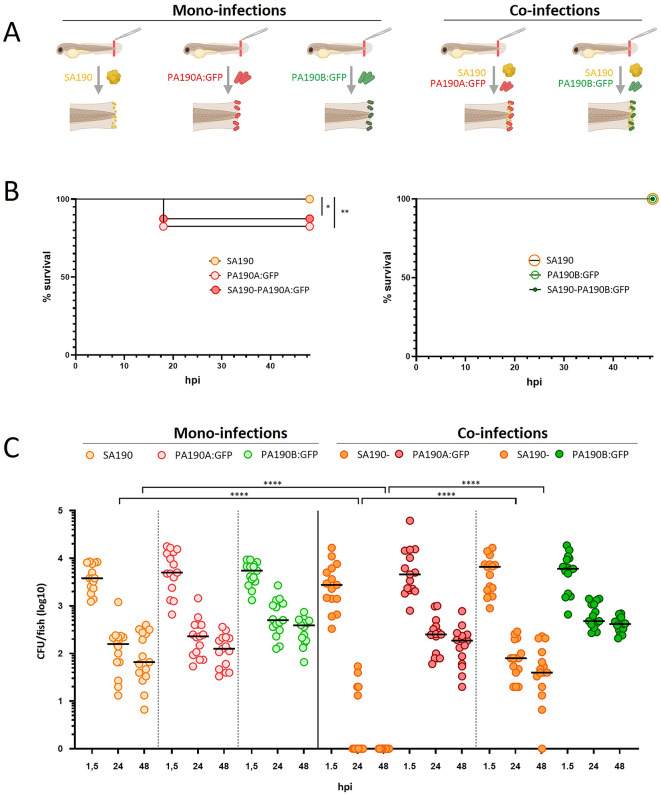
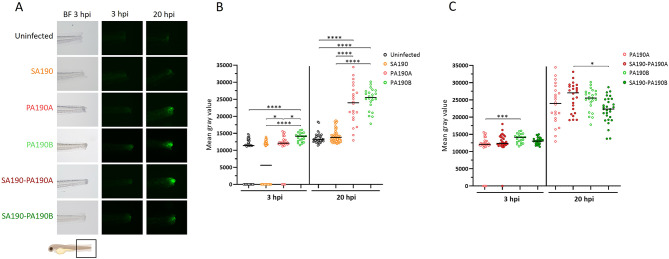
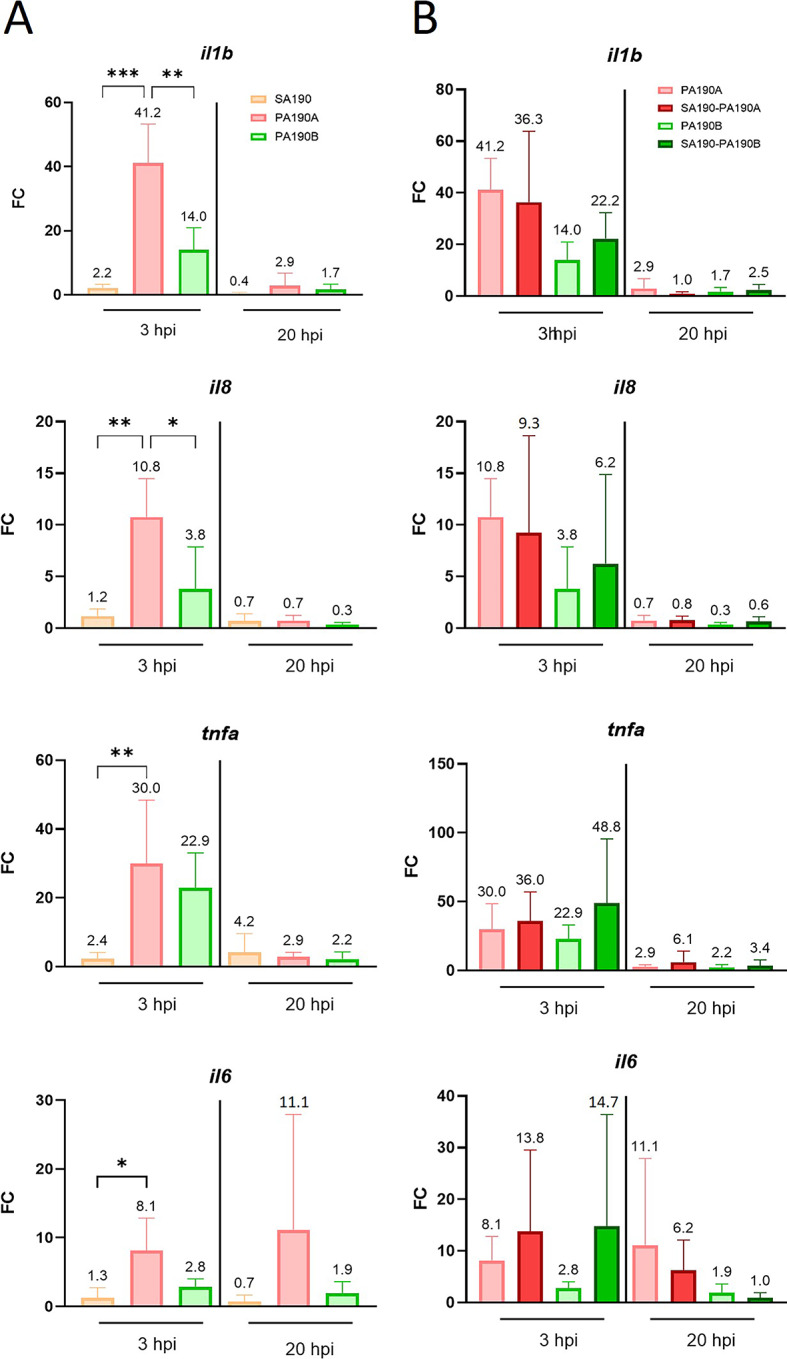
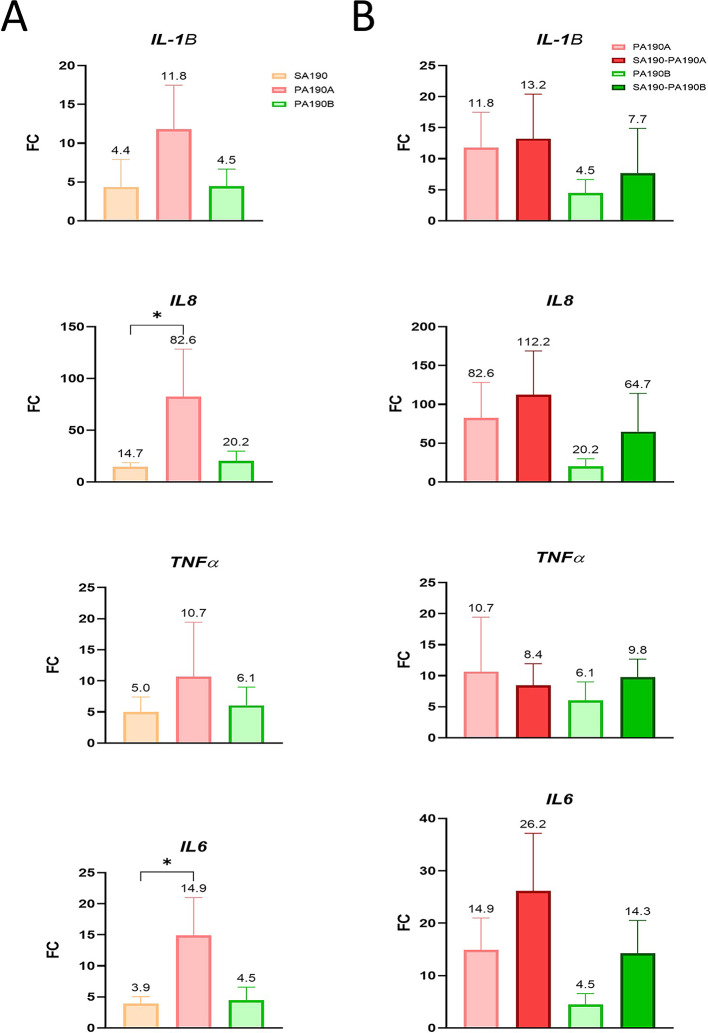
Investigating the interplay between polymicrobial colonization and host response in the context of chronic infections is a complex issue. The interaction between Staphylococcus aureus and Pseudomonas aeruginosa, which frequently co-infect patients with chronic diseases like cystic fibrosis (CF), can be either competitive or coexistent. How these interaction states can influence the host response remains an open question for which relevant infection models are needed. In this study, we investigated co-infections by P. aeruginosa and S. aureus in zebrafish (Danio rerio), a non-mammalian model well established for the study of the host innate immune response. Using a wound infection method and a trio of strains co-isolated from a CF patient, we provide an in vivo co-infection model that recapitulates the competitive and coexistent bacterial interactions observed in vitro. The inflammatory response, monitored through the expression of specific cytokines at the infection site or in the whole larvae, was stronger with P. aeruginosa than S. aureus in the context of mono-infection. Upon co-infection, a competitive or coexistent interaction between P. aeruginosa and S. aureus appeared to slightly modulate this response. Moreover, the RT-qPCR profile of cytokine response observed in zebrafish larvae was similar to the one observed after infection of human lung epithelial cells. Thus, the zebrafish embryo appears as a relevant model to study persistent co-infection with P. aeruginosa and S. aureus, offering unique opportunities to address the host response in this polymicrobial context.

Keywords: Pseudomonas aeruginosa; Staphylococcus aureus; Co-infection; Inflammatory response; Zebrafish model.


Conflict of interest statement

Declarations. Competing interests: The authors declare no competing interests.

Figures

Fig. 1
Fig. 1
In vitro competitive or coexistent phenotypes of P. aeruginosa and S. aureus strains. (A). Visualization of competition on agar plate. TSA plates were inoculated with a loan of S. aureus SA190 culture and a drop of P. aeruginosa PA190A and PA190B suspension was placed on the plate (indicated by the arrows). Plates were incubated for 24 h at 37 °C. (B) Diameter size of the inhibition halo was determined from three independent experiments.
Fig. 2
Fig. 2
Virulence and persistence profiles of strains from trio 190 in mono- or co-infections in zebrafish. (A) Diagram of mono- and co-infections (created with BioRender.com). (B) Survival curves upon mono- and co-infections of zebrafish larvae (immersion of wounded larvae) with competitive strain PA190A: GFP (left panel) or coexistent strain PA190B: GFP (right panel). Survival was monitored for 48 h following the infection (n = 2, 40 larvae). Log-rang test: *P < 0.05 and **P < 0.01. (C) Bacterial CFUs (horizontal black lines indicate the median) counts from live larvae at different times after mono- or co-infections (1.5, 24 or 48 hpi). Experiments (n = 3, 5 larvae per experiment and time point). The data represent independent measurements from different larvae at each time point. Statistical analysis is made between mono- and co-infection conditions. Mann-Whitney test: ****P < 0.0001.
Fig. 3
Fig. 3
Inflammation in a mono- or co-infection context upon infection of a zebrafish il1b:GFP reporter line. (A) Images of the GFP signal at the infection site (indicated by a black square below the images) in il1b: GFP larvae. Larvae wounded at the tail were infected by immersion with SA190 and/or competitive strain PA190A or coexistent strain PA190B and imaged at 3 hpi or 20 hpi (the same larva is imaged at the two time points). BF = Bright-Field. (B) Quantification of the GFP signal in mono-infected larvae and non-infected injured embryos. Black bars represent medians. Kruskal-Wallis test: *P < 0.05, ****P < 0.0001. (C) Quantification of the GFP signal in larvae infected by PA190A or PA190B in the context of mono-infection or co-infection with SA190. Results from panels B and C were collected in the same experiments and the same dataset was used for mono-infections with PA190A and PA190B in both panels. Black bars represent medians. Kruskal-Wallis test: *P < 0.05, *** P < 0.001. Experiments have been performed at least three times (n ≥ 3), representing at least 22 fishes per condition.
Fig. 4
Fig. 4
Expression of zebrafish pro-inflammatory genes in response to mono- and co-infections. Expression of il1b, il8, tnfa and il6 genes was measured using RT-qPCR and normalized with the expression of ef1a gene. RNA was extracted from 10 larvae after mono- or co-infections at 3 hpi and 20 hpi. (A) Inflammatory response upon mono-infections. (B) Inflammatory response caused by PA190A and PA190B in the context of mono- or co-infection. Results from panels A and B were collected in the same experiments and the same dataset was used for mono-infections with PA190A and PA190B in both panels. Data are presented as fold change (FC) of gene expression in infected larvae vs. non infected with FC = 2^(−ΔΔCT). Values are the means ± standard error of the mean (SEM) of four replicates (n = 4 from pools of 10 larvae per timepoint, 40 larvae in total). Statistical analysis was done using a one-way ANOVA followed by a Tukey post-hoc test. *P < 0.05; **P < 0.01; ***P < 0.001.
Fig. 5
Fig. 5
Expression of CFBE cells pro-inflammatory genes in response to mono- and co-infections. Expression of IL1B, IL8, TNFα and IL6 genes was measured using RT-qPCR and normalized with the expression of GAPDH and RPS18 genes. RNA was extracted from CFBE cells after 6 h of infection. (A) Inflammatory response upon mono-infections. (B) Inflammatory response caused by PA190A and PA190B in the context of mono- or co-infections. Results from panels A and B were collected in the same experiments and the same dataset was used for mono-infections with PA190A and PA190B in both panels. Data are presented as FC of gene expression of infected cells vs. non infected cells with FC = 2^(−ΔΔCT). Values are the means ± standard error of the mean (SEM) of four replicates. Statistical analyses were done using a Kruskal-Wallis test followed using a Dunn test. *P < 0.05.

References

    1. Serra, R. et al. Chronic wound infections: the role of Pseudomonas aeruginosa and Staphylococcus aureus. Expert Rev. Anti-Infe. 13, 605–613 (2015). - PubMed
    1. Khanolkar, R. A. et al. Ecological succession of polymicrobial communities in the cystic fibrosis airways. Msystems 5, 809 – 20 (2020). - PMC - PubMed
    1. Tacconelli, E. et al. Discovery, research, and development of new antibiotics: the WHO priority list of antibiotic-resistant bacteria and tuberculosis. Lancet Infect. Dis.18, 318–327 (2018). - PubMed
    1. Camus, L., Briaud, P., Vandenesch, F. & Moreau, K. How bacterial adaptation to cystic fibrosis environment shapes interactions between Pseudomonas aeruginosa and Staphylococcus aureus. Front. Microbiol.12, 617784 (2021). - PMC - PubMed
    1. Metzger, M. I. et al. A volatile and dynamic longitudinal Microbiome is associated with less reduction in lung function in adolescents with cystic fibrosis. Front. Cell. Infect. Microbiol.11, 763121 (2021). - PMC - PubMed

MeSH terms

LinkOut - more resources