. 2025 Jul 4;15(1):23930.
doi: 10.1038/s41598-025-09010-1.

Multi-omics analysis identifies SNP-associated immune-related signatures by integrating Mendelian randomization and machine learning in hepatocellular carcinoma

Affiliations

Multi-omics analysis identifies SNP-associated immune-related signatures by integrating Mendelian randomization and machine learning in hepatocellular carcinoma

Qingyan Kou et al. Sci Rep. .

Abstract

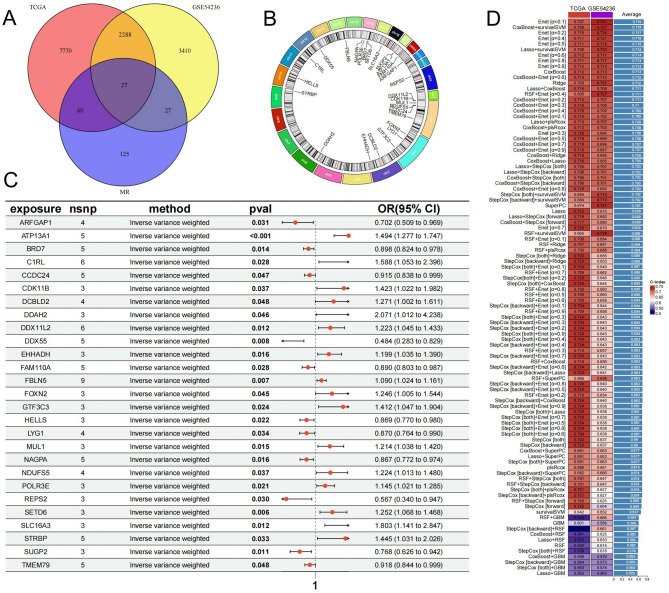
Hepatocellular carcinoma (HCC) is a leading cause of cancer-related death globally, characterized by high morbidity and poor prognosis. The complex molecular and immune landscape of HCC makes accurate patient stratification and personalized treatment essential. In this study, we utilized large-scale gene expression data from TCGA and GSE54236, alongside eQTL GWAS data, to identify key genes that influence HCC prognosis. Machine learning analysis was performed on the genes identified through Mendelian randomization (MR) and survival association analysis, using 101 algorithms to construct a robust prognostic model. A novel riskScore model was developed by integrating genetic, clinical, and immune cell infiltration data. The prognostic performance of model was validated through survival analysis, and its association with chemotherapy and immunotherapy sensitivity. The impact of key genes on the proliferation and invasion capabilities of HCC cells was assessed through Western blot (WB), EdU, and invasion assays. A total of 27 candidate genes associated with HCC survival were identified, with 16 genes categorized as high-risk. The riskScore model demonstrated excellent performance in stratifying patients into high-risk and low-risk groups, with C-index exceeding 0.7 for both TCGA and GSE54236 datasets. High-risk patients exhibited poorer prognosis and higher immune cell infiltration, particularly T cells and neutrophils. The model also predicted drug sensitivity, with high-risk patients showing greater sensitivity to chemotherapy agents like 5-Fluorouracil and Paclitaxel. Mutation analysis revealed that TP53 and MUC16 mutations were prevalent in high-risk groups, highlighting their role in HCC progression and therapeutic response. And the key gene SLC16A3 and STRBP can significantly promote the proliferation and invasion ability of HCC cells. Our riskScore model, integrating genetic and immune factors, provides a robust prognostic tool with potential clinical application in patient stratification and chemotherapy decision-making for HCC patients.

Keywords: Chemotherapy sensitivity; Genetic mutation; HCC; Immune checkpoint; Immune microenvironment; MR; Prognostic; RiskScore.


Conflict of interest statement

Declarations. Competing interests: The authors declare no competing interests. Consent for publication: All authors informed and consent.

Figures

Fig. 1
Fig. 1
Gene screening and machine learning model construction. (A) The intersection of risk genes in MR and prognostic genes in TCGA and GSE54236. (B) The location of candidate genes on chromosomes. (C) The eQTL and HCC GWAS MR analysis results of 27 model genes. nsnp represents the number of valid SNPs. Only the results of the IVW method are shown. (D) The analysis results of 101 machine learning methods for candidate genes, showing the performance of different models in TCGA and GSE54236. The c-index value represents the performance of the model.
Fig. 2
Fig. 2
Validation of the riskScore model. (A, E) Kaplan–Meier survival curve analysis showed the survival difference between high-risk group and low-risk group in TCGA and GSE54236. (B, C, F, G) ROC curve was used to evaluate the predictive ability of different clinical factors and riskScore model at different time points. (D, H) The independent predictive ability of riskScore and clinical variables (such as age, gender, pathological stage) on patient prognosis was measured by C-index value. (I, K) Univariate Cox regression analysis results of riskScore between different clinical factors and risk groups. (J, L) Multivariate Cox regression analysis results of riskScore after adjusting clinical variables.
Fig. 3
Fig. 3
Differential pathway analysis between high-risk and low-risk groups. Differential signal pathway analysis between high-risk and low-risk groups, (A) GO; (B) KEGG; (C) Hallmark.
Fig. 4
Fig. 4
Differences in immune signaling pathways between high-risk and low-risk groups. Enrichment of high-risk and low-risk groups in different tumor and immune cell gene sets, (A) Tumor progression-related pathways; (B) Immune-related gene sets; (C) Immune response-related pathways; (D) Signature gene sets for the 7 steps of immune response.
Fig. 5
Fig. 5
Relationship between riskScore and immune microenvironment. (A) Correlation analysis between riskScore and the level of tumor immune cell infiltration using 6 methods. (B) Correlation analysis between riskScore and the results of ssGSEA analysis of immune gene sets. (C) Correlation analysis between riskScore and TIDE analysis results. (D, E) Expression of immune co-inhibitory checkpoints and immune co-stimulatory checkpoints in high-risk and low-risk groups. (F, H) Differences in StromalScore and ESTIMATEScore values between high-risk and low-risk groups. (G, I) Correlation analysis between riskScore and StromalScore and ESTIMATEScore.
Fig. 6
Fig. 6
Relationship between riskScore and clinical pathological characteristics of HCC. (A) Sankey diagram showing the proportion of high-risk and low-risk groups and TIDE immune response and patient survival and clinical stage. (B, D, F) The proportion of T stage, stage, and survival status between high-risk and low-risk groups. (C, E, G) Differences in riskScores of patients with different T and Stage, and differences in riskScores of patients who survive and die. (H, J) Analysis of differences in TMB and MaxVAF values of patients in high-risk and low-risk groups. (I, K) Correlation analysis between riskScore and TMB and MaxVAF values.
Fig. 7
Fig. 7
Genetic mutation characteristics of high-risk and low-risk groups. (A, B) show the gene mutation characteristics of the top 20 in the TCGA dataset for the high-risk and low-risk groups. (C, D) Gene co-mutation analysis shows the differences in the co-occurrence patterns of gene mutations between the high-risk and low-risk groups. (E, F) Box plots show the differences in the clonal status of gene mutations between the high-risk and low-risk groups.
Fig. 8
Fig. 8
Relationship between riskScore and chemotherapy drug sensitivity. (AF) Differences in IC50 values of common chemotherapy drugs between high-risk group and low-risk group predicted by oncopredict in GDSC2 data. (GL) Correlation analysis between riskScore and IC50 values of different chemotherapy drugs using “pRRophetic” package.
Fig. 9
Fig. 9
Comprehensive model of riskScore and patient prognosis prediction. (A) Multivariate Cox regression analysis results combining age, gender, pathological stage, TMB and riskScore. (B) TCGA liver cancer samples were divided into four groups according to TMB and riskScore, and the Kaplan–Meier survival curve showed the survival between the groups. (C) Nomogram model based on pathological stage, TMB and riskScore for prognosis evaluation of liver cancer patients. (D) Calibration curve to evaluate the accuracy and specificity of the Nomogram model in 1-year, 3-year and 5-year survival prediction. (E) The AUC values of the Nomogram model, riskScore, Stage and TMB.
Fig. 10
Fig. 10
Expression of SLC16A3 and STRBP and their proliferation and invasion abilities. (A) Protein expression of SLC16A3 and STRBP in normal liver cell lines and tumor cell lines. (B) Protein expression of SLC16A3 in PLC/PRF/5 after knockdown of SLC16A3. (C) Protein expression of STRBP in MHCC97H after knockdown of STRBP. (D, E) The edu-488 levels in the nuclei of PLC/PRF/5 and MHCC97H cells after knockdown of SLC16A3 and STRBP. (F, G) The invasion of PLC/PRF/5 and MHCC97H cells after knockdown of SLC16A3 and STRBP.

References

    1. Jemal, A. et al. Annual report to the Nation on the Status of Cancer, 1975–2014, featuring survival. J. Natl. Cancer Inst109, (9) djx030 (2017). - PMC - PubMed
    1. Sung, H. et al. Global cancer statistics 2020: GLOBOCAN estimates of incidence and mortality worldwide for 36 cancers in 185 countries. CA Cancer J. Clin.71 (3), 209–249 (2021). - PubMed
    1. Bray, F. et al. Global cancer statistics 2018: GLOBOCAN estimates of incidence and mortality worldwide for 36 cancers in 185 countries. CA Cancer J. Clin.68 (6), 394–424 (2018). - PubMed
    1. Hou, Z. et al. Use of chemotherapy to treat hepatocellular carcinoma. Biosci. Trends. 16 (1), 31–45 (2022). - PubMed
    1. Llovet, J. M. et al. Immunotherapies for hepatocellular carcinoma. Nat. Rev. Clin. Oncol.19 (3), 151–172 (2022). - PubMed

MeSH terms

Substances