. 2025 Aug;28(8):1772-1786.
doi: 10.1038/s41593-025-01991-6. Epub 2025 Jul 4.

Human thalamocortical structural connectivity develops in line with a hierarchical axis of cortical plasticity

Affiliations

Human thalamocortical structural connectivity develops in line with a hierarchical axis of cortical plasticity

Valerie J Sydnor et al. Nat Neurosci. 2025 Aug.

Abstract

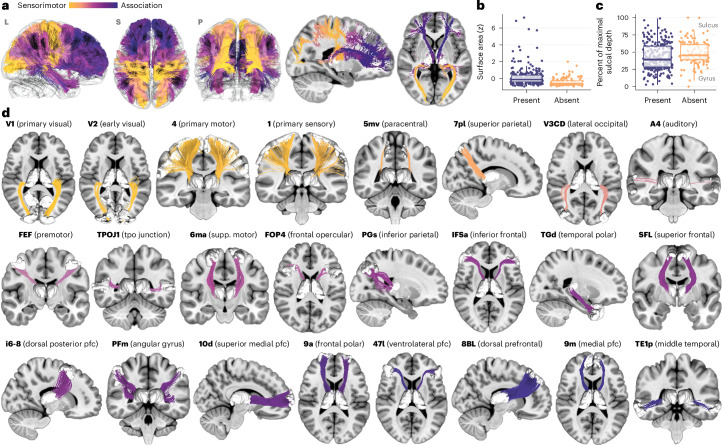
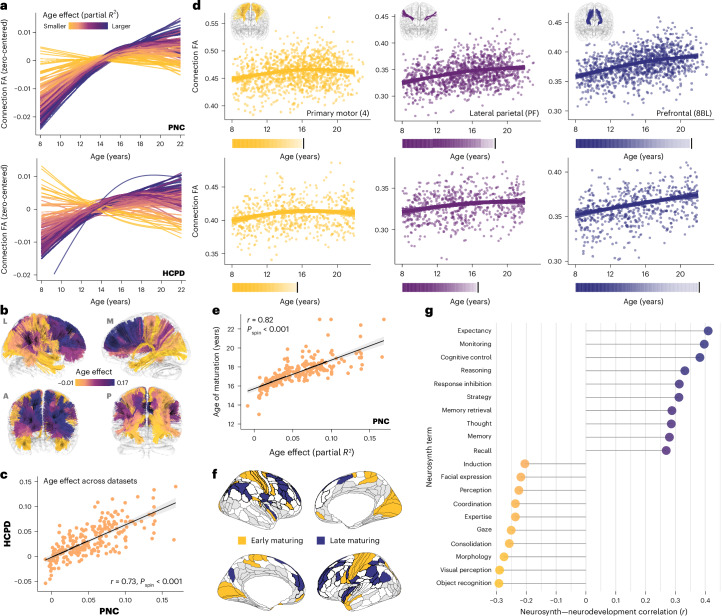
Human cortical development follows a hierarchical, sensorimotor-to-association sequence. The brain's capacity to enact this sequence indicates that it relies on unknown mechanisms to regulate regional differences in the timing of cortical maturation. Given evidence from animal systems that thalamic axons mechanistically regulate periods of cortical plasticity, here we evaluate in humans whether the development of structural connections between the thalamus and cortex aligns with cortical maturational heterochronicity. By deriving a new tractography atlas of human thalamic connections and applying it to diffusion data from three youth samples (8-23 years; total n = 2,676), we demonstrate that thalamocortical connectivity matures in a generalizable manner along the cortex's sensorimotor-association axis. Associative cortical regions with thalamic connections that take the longest to mature exhibit neurochemical, structural and functional signatures of protracted developmental plasticity as well as heightened sensitivity to the socioeconomic environment. This work highlights the role of the thalamus in the expression of hierarchical periods of cortical developmental plasticity and environmental receptivity.


Conflict of interest statement

Competing interests: The authors declare no competing interests.

Figures

Fig. 1
Fig. 1. An atlas of regionally specific thalamocortical structural connections.
a, All connections that constitute the population-level thalamocortical tractography atlas are shown in 3D views as well as in 2D slices. Connections exhibit broad cortical coverage and are colored by the cortical endpoint’s position along the S–A axis of brain organization. The color bar represents S–A axis ranks and ranges from rank 1 (sensorimotor pole) to rank 360 (association pole). b, Surface area z scores are plotted separately for cortical regions with and without connections included in the thalamocortical tractography atlas; 360 cortical regions defined by the HCP–MMP cortical parcellation were studied. c, The relative sulcal depth of cortical regions with and without connections included in the thalamocortical tractography atlas is shown based on the 360 regions that comprise the HCP–MMP parcellation. Sulcal depths ranged from 0% of maximal sulcal depth (gyral crowns) to 100% of sulcal depth (sulcal banks). In c and d, box plots summarizing data distributions are included (centerline—median; hinges—first and third quartiles; whiskers—1.5× interquartile range). d, Exemplar thalamocortical connections included in the tractography atlas are displayed. Connections are arranged from lowest (V1; yellow) to highest (TE1p; dark blue) position in the S–A axis. L, lateral; S, superior; P, posterior. Source data
Fig. 2
Fig. 2. Thalamocortical structural connections are consistently reconstructed in individual participants.
Exemplar thalamocortical connections included in the population-level tractography atlas (rows 1 and 4) are shown here, reconstructed in individual participants from PNC (rows 2 and 5) and HCPD (rows 3 and 6). Person-specific connections were robust and exhibited excellent reconstruction accuracy. Connection colors match those used in Fig. 1 and reflect the S–A axis rank of the thalamic connection’s cortical endpoint, ranging from the sensorimotor pole of the axis (yellow) to the association pole (blue). Each connection shown in the PNC and HCPD datasets is from a different participant; a random number generator was used to select which participant’s data to show. Data are shown from study participants that span the full age range in PNC (minimum age = 8.3 years, first quartile = 11.7 years, mean = 14.6 years, third quartile = 17.5 years, maximum age = 22.0 years) and in HCPD (minimum age = 8.9 years, first quartile = 11.0 years, mean = 14.9 years, third quartile = 18.6 years, maximum age = 21.8 years).
Fig. 3
Fig. 3. Identified structural connections reflect key features of thalamocortical circuit anatomy.
a, The C–Mt gradient derived in prior work maps spatial variation in the relative distribution of different thalamic projection cell types. This gradient, defined and visualized within the thalamus, spans from areas with the highest relative proportion of core-like thalamic projection neurons (yellow voxels; lower C–Mt values) to areas with the highest proportion of matrix-like neurons (dark purple voxels; highest C–Mt values). C–Mt values range from −0.3 to 0.2. b, Thalamocortical connections were each assigned a C–Mt value, indexing their position in the C–M gradient, based on where their streamlines terminated within the thalamus. Connection-specific C–Mt values are plotted in PNC and HCPD. C–Mt values were nearly perfectly correlated between datasets, confirming that delineated pathways terminated in the same areas of the thalamus across datasets. c, Thalamic connection C–Mt values positively correlated with the S–A axis rank of the connection’s cortical partner in both PNC (left) and HCPD (right). Both datasets showed evidence of core-to-sensory and matrix-to-association thalamocortical connectivity motifs. The positive linear relationship between S–A axis ranks and C–Mt values is plotted with a 95% confidence interval. d, Thalamocortical connections are shown colored by mean FA (dark yellow—highest FA; dark purple—lowest FA). FA values range from 0.2 to 0.5 across connections. e, FA values are plotted for all thalamocortical connections in PNC and HCPD. FA robustly correlated between datasets, demonstrating that this microstructural connectivity measure exhibits highly reproducible variability across thalamic pathways. f, Thalamocortical connection FA values monotonically decreased along the S–A axis in PNC (left) and HCPD (right), revealing a continuum of connection strength and coherence that exhibits systematic hierarchical variation. The negative linear relationship between S–A axis ranks and FA is plotted with a 95% confidence interval. In b, c, e and f, Spearman’s correlations were used to calculate r values, and the significance of the correlation was determined using conservative spin-based spatial rotation tests. Source data
Fig. 4
Fig. 4. Variability in the magnitude and timing of thalamocortical structural connectivity development.
a, A spectrum of FA developmental trajectories manifests across thalamocortical connections in PNC (top) and HCPD (bottom). Developmental trajectories are GAM smooth estimates that are independently zero-centered along the y axis for each connection. Trajectories are colored by the connection’s age effect (partial R2) and represent the partial effect of age on FA conditional on model covariates. b, Thalamocortical connections from the tractography atlas are colored by their age effect, revealing the brain-wide distribution of developmental heterogeneity. c, A correlation plot confirming close correspondence between connection-specific age effects derived across datasets is shown; the linear fit (with 95% confidence interval) is plotted. The result of Spearman’s correlation with a spin test is indicated. d, Developmental trajectories for thalamic connections to primary motor, lateral parietal and superior prefrontal cortical regions are shown, overlaid on participants’ data, in PNC (top) and HCPD (bottom). Trajectories represent GAM-predicted FA values with a 95% credible interval. Corresponding color bars chart the rate of increase in FA during windows of significant developmental change. e, Connection-wise age effects and ages of maturation were correlated (PNC data and linear fit shown with a 95% confidence interval). The result of Spearman’s correlation with a spin test is indicated and confirms that the age of maturation metric provides insight into both the magnitude and timing of development. f, A brain map localizing cortical regions with the earliest-maturing thalamic connections (age of maturation first quartile; yellow) and latest-maturing thalamic connections (fourth quartile; blue) is shown. White and gray regions matured in middle age quantiles and were not included in the atlas, respectively. g, Results of a Neurosynth analysis used to functionally decode differences in thalamocortical connectivity maturational timing. Psychological terms linked to cortical regions with early-maturing thalamic connections are shown in yellow. Terms associated with cortical regions with the late-maturing thalamic connections are shown in blue. PNC data are presented; 11 terms that were also present in the HCPD Neurosynth analysis are written in bold font. L, lateral; M, medial; A, anterior; P, posterior. Source data
Fig. 5
Fig. 5. Thalamocortical structural connections mature at progressively older ages along the S–A axis.
a, Developmental increases in FA persist for progressively longer for thalamic connections to cortical regions ranked higher in the S–A axis. Age windows during which thalamocortical connections showed significant increases in FA are highlighted for every connection. Connections are ordered along the y axis and colored by the S–A axis rank of the connection’s cortical endpoint. Windows of significant developmental change demarcate ages where the first derivative of the GAM smooth function for age was significantly greater than 0, as determined by a simultaneous 95% confidence interval. b, The S–A axis (left) exhibits shared spatial topography with a maturational map depicting the age at which each cortical region’s thalamic connection matured (right; PNC data). Light gray regions in these cortical maps were not analyzed or did not show significant developmental effects. c, Thalamocortical connections from the tractography atlas are colored by the connection’s age of maturation to further illustrate connection-wise differences in maturational timing. d, Ages of thalamic connection maturation systematically vary along the S–A axis in both PNC (left) and HCPD (right). Thalamocortical connections to the axis’s association pole tended to mature at the oldest ages. The linear relationship between S–A axis rank and maturational age is shown with a 95% confidence interval in both plots. The r value from Spearman’s correlation and the significance of the correlation (Pspin) as determined by a spin-based spatial rotation test are additionally provided for both plots. Significance values (Pspin) were corrected across all spatial axis correlations using the FDR correction. e, Results of the PNC analysis quantifying the alignment of thalamic connection maturational timing to the S–A axis as well as major cortical and thalamic axes. The correlation with maturational timing was stronger for the S–A axis than for A–P, D–V and M–L cortical axes, as well as the C–Mt thalamic gradient. Only the correlation with the S–A axis was significant, as determined by spatial null model testing. * indicates a Pspin-FDR value < 0.05 for the correlation between connection maturational timing and a spatial axis. Source data
Fig. 6
Fig. 6. Thalamocortical structural connection maturation synchronizes with timescales of cortical plasticity.
Developmental refinements in cortical plasticity markers are coordinated with thalamocortical connection maturation in PNC (left column) and HCPD (right column). Cortical maps charting the in vivo development of the E/I ratio (a; magnitude of maturational decline), cortical myelin (b; rate of developmental growth) and intrinsic activity amplitude (c; age of decrease onset) are shown. In all three cortical maps, darkest blue brain regions are those that express signatures of protracted developmental plasticity. a, Cortical regions with thalamic connections that mature at older ages undergo smaller age-related declines in the E/I ratio during childhood and adolescence (less negative age slopes), implying that they remain in a less mature, plasticity-permissive state for longer. E/I ratio was estimated in developmental data in ref. by applying a biophysically realistic computational circuit model to resting-state fMRI data. b, Cortical regions with thalamic connections that mature at older ages show a slower rate of T1/T2 ratio-indexed cortical myelin growth, suggesting that they exhibit slower formation of a structural feature that restricts developmental plasticity. T1/T2 ratio development data is from ref. . c, Cortical regions with thalamic connections that mature at older ages exhibit later-onset declines in the amplitude of intrinsic activity fluctuations, indicative of temporally delayed reductions in a potential functional signature of developmental plasticity. The age at which intrinsic activity amplitude began to decrease in each cortical region was determined by ref. through developmental modeling of age-related changes in BOLD fluctuation amplitude. In ac, correlation plots include a linear fit with a 95% confidence interval band and provide the r value from Spearman’s correlation and the Pspin value from a spin test; Pspin values were FDR corrected across plasticity map correlations. Source data
Fig. 7
Fig. 7. Hierarchically organized relationships between the neighborhood environment and thalamocortical structural connectivity.
a, Thalamocortical connections that exhibited a significant, positive association between neighborhood socioeconomic advantage and connection FA are presented in purple. The cortical endpoints of these connections are also shown, colored by the statistical t value of the environment effect. The largest t values localized to the lateral frontal and temporal cortices. White and gray denote cortical regions that had nonsignificant environmental effects and that were not included in the tractography atlas, respectively. b, GAM-predicted trajectories of FA development are displayed for low (10th percentile) and high (90th percentile) neighborhood factor scores for thalamic connections to five quintiles of the S–A axis. Trajectories reveal that environment-related differences in connection FA persist from childhood to early adulthood. c, Results of the environment effect enrichment analysis are displayed for five quintiles of the S–A axis. Each plot shows the mean empirical t value in that quintile along with a null distribution of t values obtained from spin-based spatial null models (tspin). The enrichment test was significant in the fifth quintile of the S–A axis, indicating that environmental effects were significantly stronger for thalamic connections to the association pole of the axis as compared to the rest of the cortex. d, Environment effect t values significantly increased in magnitude for thalamic connections to cortical regions ranked higher in the S–A axis, as shown by the positive linear fit between variables (with a 95% confidence interval) and the result of Spearman’s correlation with a spin test. Nine thalamic connections with a negative t value are not shown. e, Results of an analysis correlating connection-wise environment effects with the S–A axis as well as with D–V, M–L and A–P cortical axes and the C–Mt gradient. Only the correlation with the S–A axis was significant, as determined by spatial null model testing. * indicates a Pspin-FDR value < 0.05 for the correlation between connection environment effects and a spatial axis. Source data
Fig. 8
Fig. 8. Developmental and environmental results are generalizable to youth with psychopathology.
An overview of key results from the HBN sample, a clinical sample of youth that is enriched for psychopathology. a, Structural connections between the thalamus and cortex exhibit heterogenous profiles of FA development. b, Connection-specific age effects derived in HBN correlate with those obtained in PNC; the linear relationship between dataset-specific age effects is plotted with a 95% confidence interval. c, Neurosynth-based contextualization of thalamocortical connection developmental timing reveals psychological functions associated with cortical regions with early-maturing thalamic connections (yellow; negatively correlated terms) and late-maturing thalamic connections (blue; positively correlated terms). d, The age at which thalamocortical connections mature progressively increased for connections to cortical regions located higher in the S–A axis, resulting in a positive correlation between ages of thalamic pathway maturation and S–A axis ranks. The linear relationship between these variables is shown with a 95% confidence interval. e, Thalamocortical connection maturation significantly correlated with noninvasively derived maps charting the development of cortical properties, including the development of the cortical E/I ratio, cortical T1/T2 ratio and cortical BOLD activity fluctuation amplitude. The strength and significance of each of these three correlations are indicated. f, A plot depicting the significant correlation between thalamic connection environment effects (statistical t values) and the S–A axis is shown (linear fit with a 95% confidence interval). Positive environment effects indicate that more socioeconomically advantaged neighborhood environments were associated with higher thalamocortical connection FA. Environmental effects strengthened toward the axis’s association pole. g, The environment enrichment analysis confirmed that neighborhood environment effects were significantly greater in magnitude for thalamic connections to the fifth quintile of the S–A axis as compared to connections with the rest of the cortex. * indicates a quintile enrichment Pspin value < 0.05. In b, d, e and f, the r values and Pspin values from independent Spearman’s correlations with spin tests are denoted. Source data
Extended Data Fig. 1
Extended Data Fig. 1. Anatomical validation of the thalamocortical tractography atlas.
Individual connections included in the tractography atlas of human thalamocortical structural connections were validated against prior gold-standard tractography and tract tracing studies. Each panel (ah) compares a previously published characterization of thalamocortical structural connectivity to the current atlas. A description of the data and methodological approach used by the prior publication is included at the bottom of each panel. Connections in the current atlas were compared to those derived in prior human imaging studies that examined structural connectivity between the thalamus and primary visual cortex (a; ref. ), primary motor cortex (b; ref. ), pars triangularis of the inferior frontal gyrus (c; ref. ), posterior Brodmann area (BA) 9 (d; ref. ) and the dorsolateral prefrontal cortex (e; ref. ). The topographic patterning of connections included in the current atlas was additionally compared to prior findings from macaque studies that used tract tracing to examine thalamic origins of axons projecting to motor cortex (f; ref. ) and prefrontal cortex (g; ref. ), as well as a study that used tract tracing to calibrate outputs of prefrontal tractography (h; ref. ). A more detailed description of the prior studies and the comparisons made in each panel is provided in the Supplementary Information.

References

    1. Sydnor, V. J. et al. Neurodevelopment of the association cortices: patterns, mechanisms, and implications for psychopathology. Neuron109, 2820–2846 (2021). - PMC - PubMed
    1. Sydnor, V. J. et al. Intrinsic activity development unfolds along a sensorimotor–association cortical axis in youth. Nat. Neurosci.26, 638–649 (2023). - PMC - PubMed
    1. Baum, G. L. et al. Graded variation in T1w/T2w ratio during adolescence: measurement, caveats, and implications for development of cortical myelin. J. Neurosci.42, 5681–5694 (2022). - PMC - PubMed
    1. Zhang, S. et al. In vivo whole-cortex marker of excitation–inhibition ratio indexes cortical maturation and cognitive ability in youth. Proc. Natl Acad. Sci. USA121, e2318641121 (2024). - PMC - PubMed
    1. Larsen, B., Sydnor, V. J., Keller, A. S., Yeo, B. T. T. & Satterthwaite, T. D. A critical period plasticity framework for the sensorimotor–association axis of cortical neurodevelopment. Trends Neurosci.46, 847–862 (2023). - PMC - PubMed

Grants and funding

LinkOut - more resources