. 2025 Jul 4;15(1):23921.
doi: 10.1038/s41598-025-09075-y.

Pan-cancer immune and stromal deconvolution predicts clinical outcomes and mutation profiles

Collaborators, Affiliations

Pan-cancer immune and stromal deconvolution predicts clinical outcomes and mutation profiles

Bhavneet Bhinder et al. Sci Rep. .

Abstract

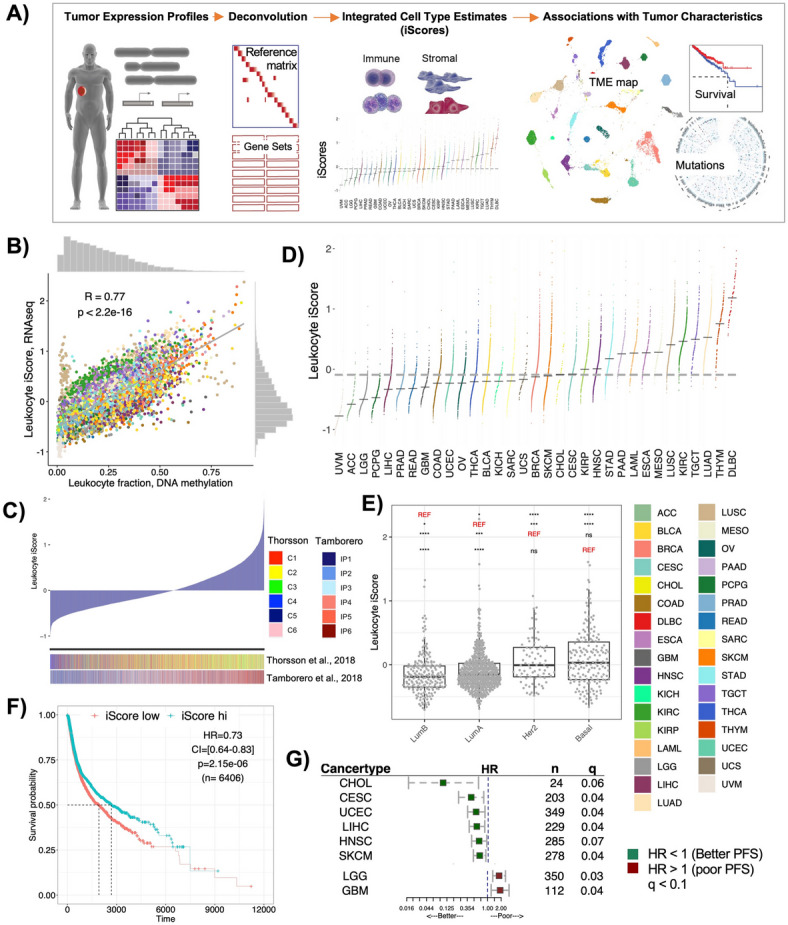
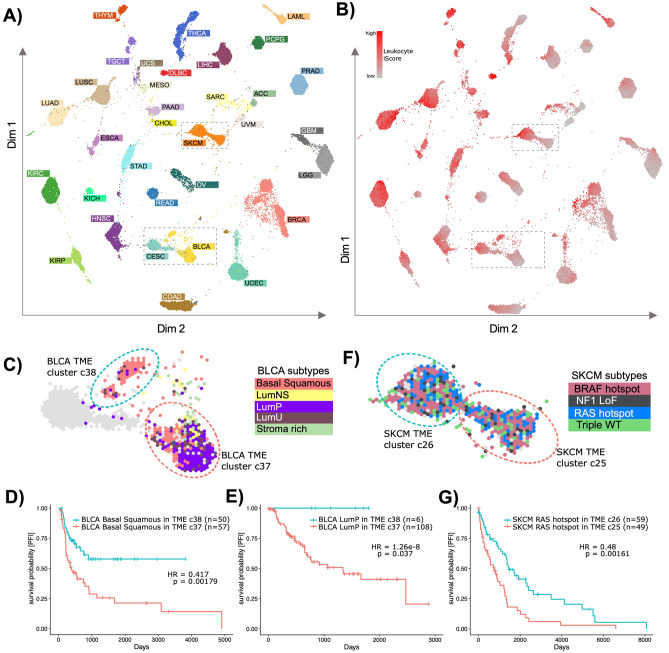
Traditional gene expression deconvolution methods assess a limited number of cell types, therefore do not capture the full complexity of the tumor microenvironment (TME). Here, we integrate nine deconvolution tools to assess 79 TME cell types in 10,592 tumors across 33 different cancer types, creating the most comprehensive analysis of the TME. In total, we found 41 patterns of immune infiltration and stroma profiles, identifying heterogeneous yet unique TME portraits for each cancer and several new findings. Our findings indicate that leukocytes play a major role in distinguishing various tumor types, and that a shared immune-rich TME cluster predicts better survival in bladder cancer for luminal and basal squamous subtypes, as well as in melanoma for RAS-hotspot subtypes. Our detailed deconvolution and mutational correlation analyses uncover 35 therapeutic target and candidate response biomarkers hypotheses (including CASP8 and RAS pathway genes).

Keywords: Cell type estimation; Deconvolution; Immune cells; Integrated scores; Pan-cancer analysis; Somatic mutations; Stroma; Survival; Tumor microenvironment; Tumor progression; iScores.


Conflict of interest statement

Competing interests: The authors declare no competing interests.

Figures

Fig. 1
Fig. 1
Deconvolution of tumor microenvironment (TME). (A) Overview of the study workflow. Tumor expression profiles were deconvolved using nine tools (either reference matrix based, or gene set based) into various cell types of the TME. The individual scores from each tool were normalized and combined as iScores. The association of these iScores were studied with cancer type, patient survival and driver mutation profiles. (B) Pan-cancer correlation between leukocyte iScores from GEPs and leukocyte fractions from DNA methylation arrays. Samples are colored by cancer type. (C) Ordered leukocyte iScores compared to the immune subtypes identified in two previously published studies. C1-6 are immune subtype clusters from Thorsson et al., (C1: Wound healing, C2: IFNg dominant, C3: Inflammatory, C4: Lymphocyte depleted, C5: Immunologically quiet, C6: TGFb dominant) and IP1-6 are immune phenotype clusters from Tamborero et al., where 1 is least cytotoxic and 6 is most cytotoxic immunophenotype. (D) Distribution of leukocyte iScores in 33 cancers ordered by median iScores. Dark gray dashes indicate cancer specific medians, gray dotted line indicates pan-cancer median. (E) Distribution of leukocyte iScores across four BRCA subtypes. Significant p-values (< 0.05) are shown with asterisk (Mann–Whitney test). ns is non-significant, and REF is reference subtype used for comparison with other subtypes. (F) Pan-cancer Kaplan–Meier survival curves for PFS in patients stratified by leukocyte iScores. High is upper tertile and low is bottom tertile of the leukocyte iScores. Low iScores are reference group. HR is hazard ratio and p is log-rank p-value from multivariate Cox-ph regression models adjusted for cancer type, tumor localization, age at the time of diagnosis and gender. (G) Cancer specific forest plots for PFS in patients stratified by individual leukocyte iScores. Low iScores are reference group Threshold of significance for FDR corrected p-values from multivariate Cox-ph (q) is 0.1.
Fig. 2
Fig. 2
Immune cell type specific iScores and their association with PFS. (A) Distribution of cell type iScores ordered by cancer specific medians. (B) Forest plots for PFS in patients stratified by individual cell type iScores (reference group: low). HR is hazard ratio and q is FDR corrected (for each cell type) log-rank p-value from multivariate Cox-ph regression models for each cell type across. Visualization is restricted to cancer types significant at q < 0.1.
Fig. 3
Fig. 3
Stroma specific iScores and their association with PFS. (A) Distribution of stromal iScores across 33 cancer types ordered by their cancer specific medians. The gray dashes indicate cancer specific medians, gray dotted line indicates pan-cancer median. (B) Pan-cancer correlations between stromal iScores and cancer stemness scores for each cancer type plotted against the p values (y-axis) for significance of correlation estimate. Significant p-values are colored red. (C) Distribution of stromal cell type iScores ordered by cancer specific medians. (D) Forest plots for PFS in patients stratified by individual stromal cell type iScores (reference group: low). HR is hazard ratio and q is FDR corrected (for each cell type) log-rank p-value from multivariate Cox-ph regression models for each cell type across. Visualization is restricted to cancer types significant at q < 0.1. See also Fig. S5. (E) Pan-cancer correlations between leukocyte and stromal iScores for each cancer type. x-axis is correlation estimates and y-axis is p values from correlation test. Significant p-values are circled in yellow.
Fig. 4
Fig. 4
TME Map using cell type iScores. (A) Two-dimensional Tumor Map projection of samples using sample similarities in cell type iScores, clustered using HDBSCAN clustering method with a minimal cluster size of 20. Each sample is colored by its cancer type. (B) TME map colored by leukocyte iScores. (C) BLCA focused part of TME Map as indicated by a dashed box in panels A and B. Samples are colored by BLCA subtype. LumNS = luminal non specified, LumP = luminal papillary, LumU = luminal unstable. clusters c37 and c38 are circled in red and blue, respectively. Kaplan–Meier survival curves for PFS between clusters c37 and c38 for BLCA. (D) Basal Squamous subtype and (E) luminal papillary subtype. HR is hazard ratio and p is p-value from the Cox-ph regression models. (F) SKCM focused part of TME map as indicated by a dashed box in panels A and B. Samples are colored by SKCM mutational subtype (LoF = Loss of function; WT = wild type). clusters c25 and c26 are circled in red and blue, respectively. (G) Kaplan–Meier survival curves for PFS between clusters c25 and c26 for SKCM RAS hotspot subtype, corrected for tumor localization.
Fig. 5
Fig. 5
Associations of somatic alterations with cell types. (A) Pan-cancer regression coefficients (|coef|> 0.1) for selected driver genes that are associated with either 15 immune or 3 stromal cell types for more than 5 tumors per cancer cohort. Thresholds: |coef|> 0.1, FDR < 0.1. (B) Circos plot for cancer-specific regression coef in immune cell types for driver genes mutated in more than 5 tumors per cancer type (|coef|> 0.1, FDR < 0.1). Histogram around the circos plot indicates the number of tumors mutated for the corresponding gene. Blue violin plots show genes mutated in > 5 tumors and associated with > 8 immune cell types per cancer. Boxplots show specific variants of significantly mutated genes within a cancer type (n > 5 tumors/cancer type). (C) Cancer-specific analyses to show differences in means of iScores for tumors segregated by high or low mutation loads bi-clustered using QUBIC (upper panel, black outline indicates FDR < 0.05), Cancer-specific regression coefficients (coef) for associations between MSI or POLE mutation status and cell type iScores (middle panel), and Leukocyte or stromal cell status (lower panel).

References

    1. Binnewies, M. et al. Understanding the tumor immune microenvironment (TIME) for effective therapy. Nat. Med.24, 541–550 (2018). - PMC - PubMed
    1. Hanahan, D. & Coussens, L. M. Accessories to the crime: functions of cells recruited to the tumor microenvironment. Cancer Cell21, 309–322 (2012). - PubMed
    1. DeClerck, Y. A., Pienta, K. J., Woodhouse, E. C., Singer, D. S. & Mohla, S. The tumor microenvironment at a turning point knowledge gained over the last decade, and challenges and opportunities ahead: a white paper from the NCI TME network. Cancer Res.77, 1051–1059 (2017). - PMC - PubMed
    1. Fridman, W. H., Pages, F., Sautes-Fridman, C. & Galon, J. The immune contexture in human tumours: impact on clinical outcome. Nat. Rev. Cancer12, 298–306 (2012). - PubMed
    1. Rao, A., Barkley, D., Franca, G. S. & Yanai, I. Exploring tissue architecture using spatial transcriptomics. Nature596, 211–220 (2021). - PMC - PubMed

Substances