. 2025 Jul 4;8(1):1006.
doi: 10.1038/s42003-025-08440-x.

Neutrophil extracellular trap gene expression signatures identify prognostic and targetable signaling axes for inhibiting pancreatic tumour metastasis

Affiliations

Neutrophil extracellular trap gene expression signatures identify prognostic and targetable signaling axes for inhibiting pancreatic tumour metastasis

Paul C McDonald et al. Commun Biol. .

Abstract

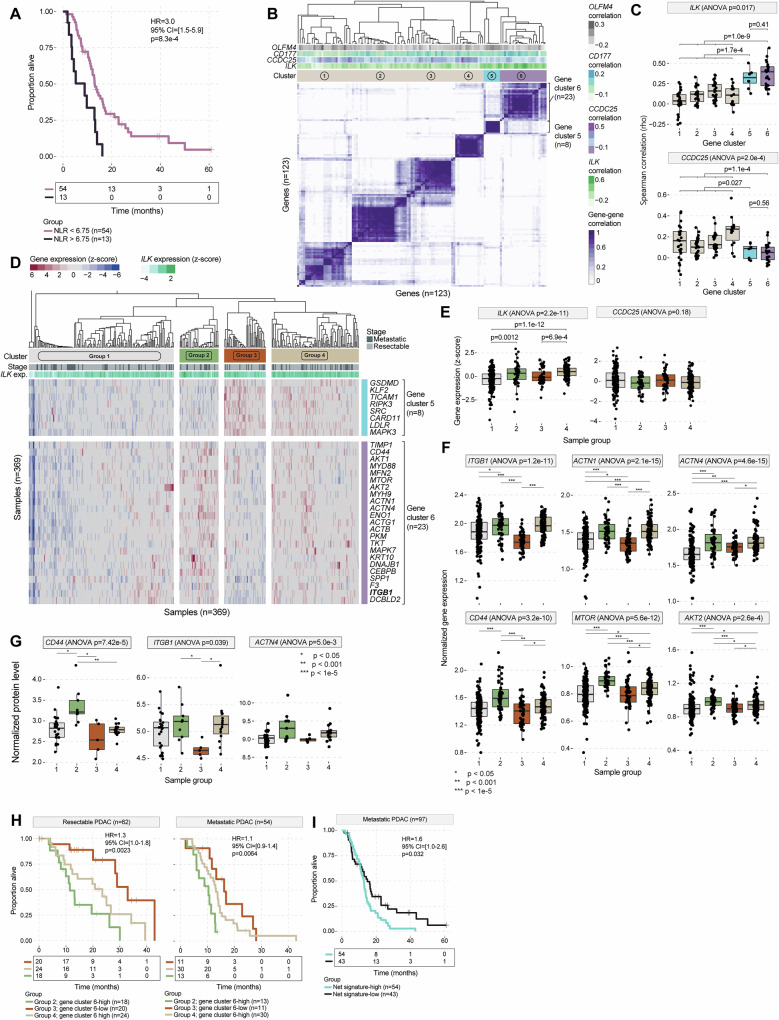
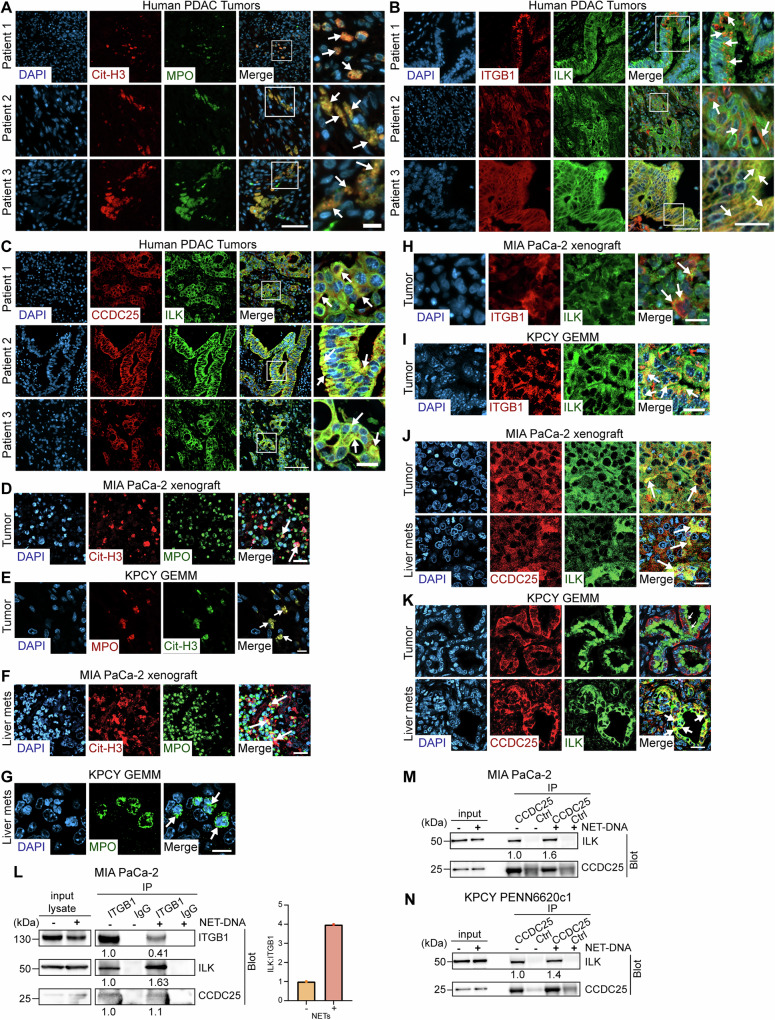
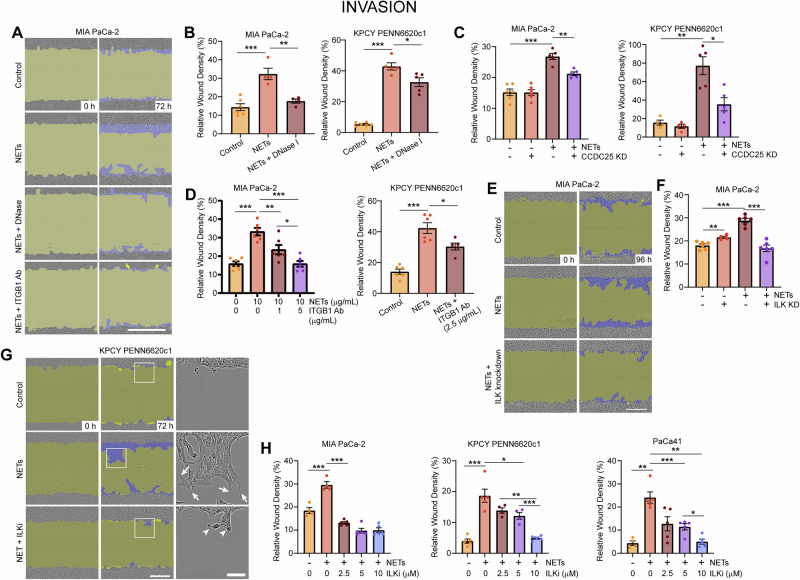
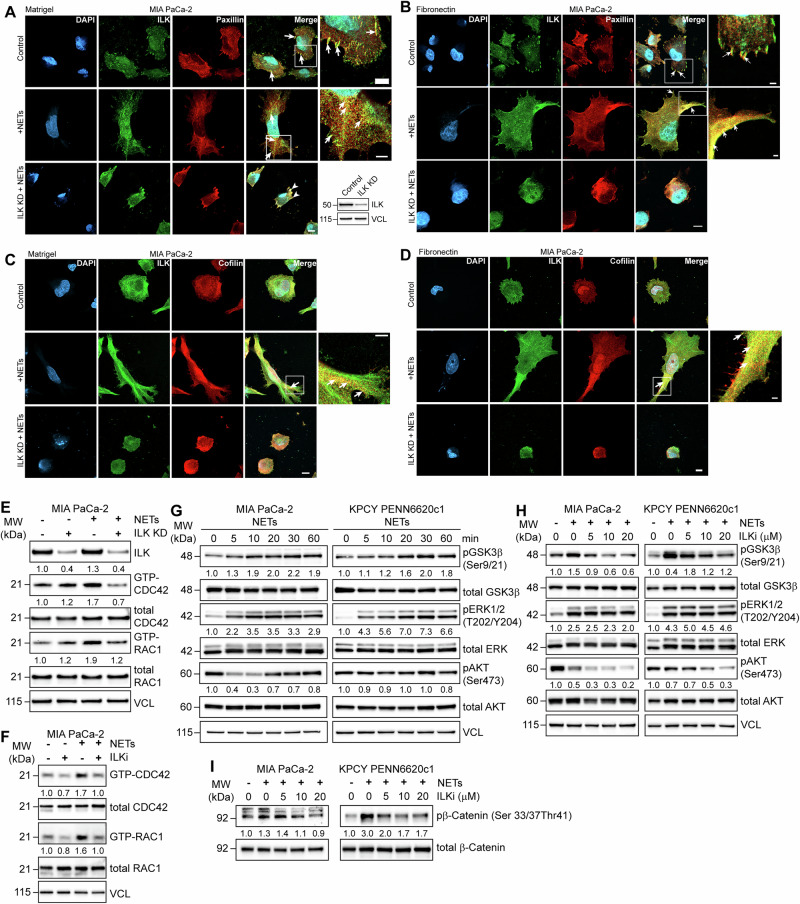
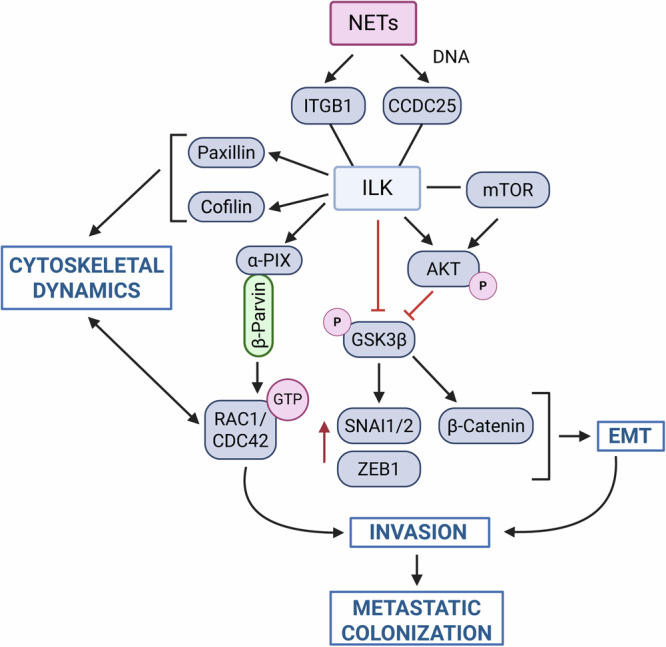
Tumour associated neutrophils (TANs) promote metastasis through interactions of Neutrophil Extracellular Traps (NETs) with tumour cells. However, molecular details surrounding the interactions between NETs and Pancreatic Ductal Adenocarcinoma (PDAC) cells are poorly understood. Here, we examine the contribution of NETs in the progression of PDAC, which is characterized by high metastatic propensity. We carry out consensus clustering and pathway enrichment analysis of NET-related genes in an integrated cohort of 369 resectable and metastatic PDAC patient tumour samples, and compile two gene expression signatures comprising of either, integrin-actin cytoskeleton and Epithelial to Mesenchymal Transition (EMT) signaling, or cell death signaling, which identifies patients with very poor to better overall survival, respectively. Tumour Infiltrating neutrophils and NETs associate with ITGB1, CCDC25 and ILK, within clinical and experimental PDAC tumours. Functionally, exposure of PDAC cells to NETs identifies a cytoskeletal dynamic-associated CCDC25-ITGB1-ILK signaling complex which stimulates EMT and migration/invasion. NETosis-driven experimental metastasis to the lungs of PDAC cells delivered through the tail vein of female non-obese diabetic (NOD) scid gamma (NSG) mice is significantly inhibited by ILK knock down. Our data identify novel NET-related gene expression signatures for PDAC patient stratification, and reveal targetable signaling axes to prevent and treat disease progression.


Conflict of interest statement

Competing interests: The authors declare no competing interests.

Figures

Fig. 1
Fig. 1. Neutrophil extracellular trap (NET) gene signatures identify pancreatic ductal adenocarcinoma (PDAC) patient outcomes.
A Kaplan–Meier survival analysis showing that a higher baseline neutrophil-to-lymphocyte ratio (NLR) is associated with shorter overall survival in patients with metastatic PDAC (n = 67). B Heat map showing the optimal consensus clustering solution for NET-related genes in human PDAC samples (resectable and metastatic combined, n = 369). Tracks above the clusters show the Spearman correlation (rho) of the indicated genes versus each gene in the heat map. C Box plots showing the relationship between expression of the indicated genes and each gene cluster identified in (B). Boxes indicate median (central line) and 25–75% IQR (bounds of box), and whiskers extend from box bounds to the largest value no further than 1.5 times the IQR. D Heat map showing clustering of human PDAC samples (n = 369) according to expression (z-score) of genes comprising a NET signature defined by consensus clustering in (B). E Box plots showing levels of gene expression (z-score) for the indicated genes in each of the sample clusters identified in (D). Box plots showing F transcript levels and G protein levels for a subset of genes across the different patient groups identified in (D). H Kaplan–Meier survival analysis of patients in groups 2, 3 and 4 with resectable (left) and metastatic (right) PDAC stratified on PDAC-specific NET signature. I Kaplan–Meier survival analysis of patients with metastatic PDAC stratified as NET-signature-high (groups 2, 3 and 4 in D) and NET-signature-low (group 1 in D). For (H, I), Log-rank test P values, hazard ratios (HR) and 95% confidence intervals (CI) are shown.
Fig. 2
Fig. 2. Neutrophils and NETs are present in ITGB1, ILK and CCDC25 expressing human PDAC tumours and preclinical xenograft models of PDAC.
A Images of representative human PDAC tumour tissue sections stained by immunofluorescence (IF) for citrullinated histone H3 (cit-H3) and myeloperoxidase (MPO) to identify neutrophils and neutrophil extracellular traps (NETs; arrows). Boxes, regions of interest (ROI) shown at higher magnification to the right. Scale bars: lower magnification, 50 μm; higher magnification, 10 μm. Images of representative human PDAC tumour tissue sections stained by IF showing co-localisation of B integrin-beta 1 (ITGB1) and integrin-linked kinase (ILK) and C coiled-coil domain-containing protein 25 (CCDC25) and ILK (arrows). Boxes, ROIs shown at higher magnification to the right. Scale bars: lower magnification, 50 μm (B), 100 μm (C); higher magnification, 20 μm (both panels). D Images of representative tissue sections from MIA PaCa-2 PDAC xenograft primary tumours stained by IF for MPO and cit-H3 to identify NETs (arrows). Scale bar, 20 μm. E Images of representative primary tumour tissue sections from the KPCY genetically engineered mouse model (GEMM) of PDAC stained by IF for MPO and cit-H3 to identify NETs (arrows). Scale bar, 10 μm. F Images of representative tissue sections of liver metastases from MIA PaCa-2 PDAC xenografts stained by IF for MPO and cit-H3 to identify NETs (arrows). Scale bar, 20 μm. G Images of representative tissue sections of liver metastases from the KPCY GEMM stained by IF for MPO to identify neutrophils (arrows). Scale bar, 10 μm. Images of representative tumour tissue sections from H MIA PaCa-2 xenografts and I the KPCY GEMM stained by IF showing co-localisation of ITGB1 and ILK (arrows). Scale bar, 20 μm. Images of representative primary tumours and liver metastases from J MIA PaCa-2 PDAC xenografts and K the KPCY GEMM stained by IF showing co-localisation of CCDC25 and ILK (arrows). Scale bar, 20 μm. L Immunoblots showing co-immunoprecipitation (co-IP) of ITGB1, ILK and CCDC25 from MIA PaCa-2 human PDAC cells cultured with 5 µg/mL NETs for 24 h. The graph of ILK:ITGB1 ratio is shown to the right. Immunoblots showing co-IP of CCDC25 and ILK from M MIA PaCa-2 human PDAC cells and N KPCY mouse PDAC cells cultured with 5 µg/mL NETs for 24 h. Quantification of band intensities is reported below the blots (LN).
Fig. 3
Fig. 3. NETs induce PDAC cell matrigel invasion in a NET-DNA, ITGB1 and ILK-dependent manner.
A Time-lapse imaging of invasion through Matrigel by MIA PaCa-2 cells cultured in the presence of 10 µg/mL NETs or DNase I-treated NETs together with DNase or function-blocking antibodies targeting ITGB1 (10 µg/mL). yellow, wound area; blue, area covered by invading cells. Scale bar, 200 µm. Quantification of NET-induced (10 µg/mL) invasion through Matrigel by human and mouse PDAC cells B exposed to DNase-treated NETs and grown in the presence of DNase, C following knockdown of CCDC25 expression using dox-inducible shRNA and D exposed to function-blocking antibodies targeting ITGB1 for 72 h. E Time-lapse imaging showing invasion through Matrigel by MIA PaCa-2 cells following depletion of ILK expression using siRNA and culture in the presence of 5 µg/mL NETs. Scale bar, 300 µm. F Quantification of NET-induced invasion by cells described in (E). G Time-lapse images of cells undergoing NET-DNA-induced invasion in the presence of a specific inhibitor of ILK, QLT-0267. Invading cells form robust membrane protrusions (arrows), which are absent when ILK activity is inhibited (arrowheads). Scale bar = 200 µm. H Quantification of NET-induced invasion by the indicated cell lines in the presence of the ILK inhibitor. Bars show mean ± SEM of n = 4–6 technical replicates and are representative of 2–3 independent experiments. *p < 0.05, **p < 0.01, ***p < 0.001, ANOVA (BD, F, H).
Fig. 4
Fig. 4. Epithelial to mesenchymal transition (EMT) is a hallmark of NETosis in PDAC tumours.
A Gene set enrichment analysis (GSEA) of differentially expressed genes in group 2 (poor outcome) versus group 3 (better outcome). Bar plot showing pathways upregulated in patient group 2 (poor prognosis) versus patient group 3 (better prognosis). B Analysis of Hallmark epithelial-mesenchymal transition (EMT) genes significantly upregulated in patient group 2 compared to patient group 3. Grey bars, strength of significance of gene dysregulation; Red squares, magnitude of differential expression; Teal bubbles, difference in protein levels for each gene; Brown ribbons, gene-gene relatedness based on GeneFriends analysis. C Western blot analysis of the indicated EMT markers in MIA PaCa-2 cells cultured in the presence of increasing concentrations of NETs for 24 h. Western blot analysis of NET-induced EMT markers in response to dox-inducible knockdown of ILK expression in D MIA PaCa-2 cells cultured with 20 µg/mL NETs for 24 h and E KPCY cells cultured with 20 µg/mL NETs for 48 h. Western blot analysis of NET-induced Zinc-finger E-box-binding homeobox 1 (ZEB1) expression in response to pharmacologic inhibition of ILK in F MIA PaCa-2 cells and G KPCY cells cultured with 10 µg/mL NETs for 48 h in the presence of 10 µM of ILKi. H Western blot analysis of NET-induced ZEB1 expression in MIA PaCa-2 cells cultured on 2.5% Matrigel with 10 µg/mL NETs for 48 h and exposed to 10 µM of the ILK inhibitor. I Western blot analysis of NET-induced ZEB1 expression in MIA PaCa-2 cultured with 10 µg/mL NETs for 48 h on the indicated substrates in the presence of 5 µg/mL function-blocking Ab against ITGB1. Quantification of band intensities is reported below the blots (CI).
Fig. 5
Fig. 5. NETs induce pseudopodia-like protrusions in an ILK-dependent manner and signal through GSK3β and RAC1/CDC42 to induce invasion.
IF staining showing co-localisation (arrows, yellow) of ILK and paxillin in control and ILK-depleted MIA PaCa-2 cells cultured on A Matrigel and B fibronectin with 20 μg/mL NETs for 24 h. Boxes, ROIs shown at higher magnification in right panels. Inset, Western blot showing dox-inducible shRNA-mediated depletion of ILK expression. Scale bar = 10 µm. Zoom scale bar = 5 µm. IF staining showing co-localisation (arrows, yellow) of ILK and cofilin in control and ILK-depleted MIA PaCa-2 cells cultured on C Matrigel and D fibronectin with 20 μg/mL NETs for 24 h. Boxes, ROIs shown at higher magnification in right panels. Scale bar = 10 µm. Zoom scale bar = 5 µm. E Immunoblot analysis showing GTP-bound and total RAC1 and CDC42 levels in control and ILK-depleted MIA PaCa-2 cells cultured with or without 20 μg/mL NETs for 24 h. F Immunoblot analysis showing GTP-bound and total RAC1 and CDC42 levels in MIA PaCa-2 cells cultured with or without 10 μg/mL NETs for 24 h and 10 μM of the ILK inhibitor. G Western blots showing levels of phosphorylation of the indicated proteins in NET-stimulated PDAC cells at the indicated time points. H Western blots showing levels of phosphorylation of the indicated proteins in PDAC cells cultured with 10 μg/mL NETs for 30 min in response to increasing concentrations of the ILK inhibitor. I Levels of phosphorylation of β-catenin in PDAC cells cultured as described in (H). Quantification of band intensities is reported below the blots (EI).
Fig. 6
Fig. 6. Inhibition of ILK suppresses NET-induced metastasis.
A Schematic showing the in vivo experimental design. B Western blot showing dox-inducible knockdown of ILK expression in MIA PaCa-2 Luc+ dox-inducible shILK cells. C Bioluminescence images showing metastatic burden in control mice and mice treated with dox to induce knockdown of ILK expression. D Quantification of bioluminescence signal in (C) (n = 7–8 per group). Bars show mean ± SEM. *p < 0.05, t-test. E Schematic showing the in vivo experimental design. F Bioluminescence images showing lung metastatic burden in control mice and mice administered LPS intranasally, with or without dox treatment at the indicated time points. G Quantification of bioluminescence signal in the lungs at the indicated time points (n = 5–6 per group). Bars show mean ± SEM. H Bioluminescence images of representative lung metastases from the indicated treatment groups at day 42 post-cell injection and quantification of metastatic burden (n = 5 to 6 per group). Bars show mean ± SEM. I IF staining of MPO in lung metastases from mice treated as indicated in (F) at 42 days after injection of MIA PaCa-2 tumour cells. Scale bar, 100 μm, 25 μm (right panels).
Fig. 7
Fig. 7. Role of NET-induced ILK signalling in PDAC invasion and metastasis.
Schematic illustration summarising the role of the NET-induced ITGB1-CCDC25-ILK signalling axis in promoting EMT, invasion and metastasis of PDAC tumour cells. Created in BioRender. McDonald, P. (2025) https://BioRender.com/k17m801.

References

    1. Siegel, R. L., Miller, K. D. & Jemal, A. Cancer statistics, 2019. CA Cancer J. Clin.69, 7–34 (2019). - PubMed
    1. Kleeff, J. et al. Pancreatic cancer. Nat. Rev. Dis. Prim.2, 16022 (2016). - PubMed
    1. Bojmar, L. et al. Multi-parametric atlas of the pre-metastatic liver for prediction of metastatic outcome in early-stage pancreatic cancer. Nat. Med.30, 2170–2180 (2024). - PMC - PubMed
    1. Guerra, C. et al. Pancreatitis-induced inflammation contributes to pancreatic cancer by inhibiting oncogene-induced senescence. Cancer Cell19, 728–739 (2011). - PMC - PubMed
    1. Steele, C. W. et al. Exploiting inflammation for therapeutic gain in pancreatic cancer. Br. J. Cancer108, 997–1003 (2013). - PMC - PubMed

MeSH terms

Substances