. 2025 Jul;57(7):1672-1683.
doi: 10.1038/s41588-025-02222-1. Epub 2025 Jul 4.

The synthetic lethal interaction between CDS1 and CDS2 is a vulnerability in uveal melanoma and across multiple tumor types

Affiliations

The synthetic lethal interaction between CDS1 and CDS2 is a vulnerability in uveal melanoma and across multiple tumor types

Pui Ying Chan et al. Nat Genet. 2025 Jul.

Abstract

Metastatic uveal melanoma is an aggressive disease with limited effective therapeutic options. To comprehensively map monogenic and digenic dependencies, we performed CRISPR-Cas9 screening in ten extensively profiled human uveal melanoma cell line models. Analysis involved genome-wide single-gene and combinatorial paired-gene CRISPR libraries. Among our 76 uveal melanoma-specific essential genes and 105 synthetic lethal gene pairs, we identified and validated the CDP-diacylglycerol synthase 2 gene (CDS2) as a genetic dependency in the context of low CDP-diacylglycerol synthase 1 gene (CDS1) expression. We further demonstrate that CDS1/CDS2 forms a synthetic lethal interaction in vivo and reveal that CDS2 knockout results in the disruption of phosphoinositide synthesis and increased cellular apoptosis and that re-expression of CDS1 rescues this cell fitness defect. We extend our analysis using pan-cancer data, confirming increased CDS2 essentiality in diverse tumor types with low CDS1 expression. Thus, the CDS1/CDS2 axis is a therapeutic target across a range of cancers.


Conflict of interest statement

Competing interests: D.J.A. has received precompetitive funding from AstraZeneca and OpenTargets. F.I. provides consultancy services for the joint Cancer Research Horizons–AstraZeneca Functional Genomics Centre and for Mosaic Therapeutics. F.I. also receives funding from OpenTargets and Nerviano Medical Sciences Srl. The remaining authors declare no competing interests.

Figures

Fig. 1
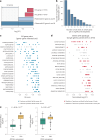
Fig. 1. Development of a combinatorial CRISPR library to screen for digenic dependencies in uveal melanoma.
a, Composition of the combinatorial CRISPR library. In total, the library targeted 514 gene pairs (blue), with each sgRNA targeting a gene in these pairs also found in the library with an STG, a design allowing us to compute the single versus double guide effect on cell fitness. The individual selection of sgRNAs in each category is described in the Methods. In addition to the abovementioned 514 pairs, we also included a collection of single essential (green) and single nonessential (yellow) genes paired with STGs to facilitate the calibration of our downstream analysis. b, Paired sgRNA construct. The first sgRNA in position 1 was placed under an hU6 promoter, and the second sgRNA in position 2 was placed under an mU6 promoter. Nonidentical tracrRNAs were used to minimize recombination (Supplementary Fig. 5). To assess single-guide activity, genes were paired with STGs placed in either position. c, Combinatorial sgRNA pairing strategy. For gene pairs A–B, 48 pgRNA combinations were used in the library where possible. In position 1, 12 sgRNAs were selected: 4 each against gene A (A1–A4), gene B (B1–B4) and safe-targeting regions of the genome (S1–S4). In position 2, another 12 unique sgRNAs were selected—4 each against gene A (A5–A8), gene B (B5–B8) and safe-targeting regions of the genome (S5–S8). This balanced design allowed us to account for any differences in sgRNA efficiency at either position. d, Screen quality was computed by calculation of NNMD values for essential/nonessential genes in the library revealing a screen performance as good as DepMap/Project Score (further QC metrics are available in Supplementary Figs. 6–9). e, Boxplot of guide-level log2(FCs) for each category of pgRNA across all ten cell lines. The colors correspond to those in a. The box shows the IQR; the line marks the median; whiskers extend to data within 1.5× IQR from Q1 and Q3; and points beyond are outliers. P values were computed using a two-tailed Wilcoxon rank-sum test (no correction was applied). IQR, interquartile range.
Fig. 2
Fig. 2. Top digenic and monogenic dependencies identified from combinatorial pgRNA CRISPR library analysis.
a, Calculation of the GI score to quantify synthetic lethality. The sum of the observed log2(FC) for sgRNAs targeting gene A and gene B was calculated to determine the predicted log2(FC) of that gene pair. The difference between the predicted and experimentally observed log2(FC) was also calculated. b, Number of significantly depleted gene pairs across the cell lines screened. c, Dot plot depicting top synthetic lethal gene pairs from the combinatorial CRISPR screen that were common to at least 6 of the 10 screened cell lines, ranked (top to bottom) by descending mean GI score. Each dot represents the GI score of a given gene pair in a single cell line. All gene pairs had previously been screened across five independent CRISPR combinatorial screens and are colored by whether they were reported to be synthetic lethal in those studies. Any pair where one of the genes was defined as lethal on its own was removed. d, Dot plot depicting significantly depleted single genes (genes with an STG) that were defined by Ensembl to have a paralog and common to at least six of the ten screened cell lines, ranked (top to bottom) by descending mean normalized log2(FC). log2(FCs) are normalized so that the median of the STGs was 0 and the median of the reference essential guides was −1. Genes are labeled with their paralog in parentheses. Each dot represents a cell line. Color indicates the synthetic lethality across five previous combinatorial CRISPR screens. A nonhit (gray) denotes a gene not previously reported to have a synthetic lethal interaction with its partner. Significance was defined using an FDR < 0.05 (Methods). e, Correlation between INTS6L expression and INTS6 gene essentiality in 316 Project Score cell lines, and the same for CDS1/CDS2. Low expressers (log2(TPM + 1) < 1) versus high expressers (log2(TPM + 1) ≥ 1) were defined using expression profiles from Cell Model Passports. Significance was determined by a t test (two-sided, equal variance). Box and whisker plots indicate median and 5th to 95th percentiles; points are outliers.
Fig. 3
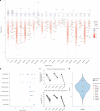
Fig. 3. Genome-wide single gRNA CRISPR screening identifies CDS2 as an essential gene in uveal melanoma.
a, Plot showing the distribution of genes in each cell line following genome-wide CRISPR screening. Dotted line denotes a MAGeCK MLE beta of +0.5 or −0.5. For each cell line, ‘_NE’ indicates scores filtered for common essential genes (DepMap 24Q2) and core essential genes (CEGv2), with genes that are significant in ≥6 lines shown as triangles (MLE beta +0.5 or −0.5 and an FDR < 0.01). The genes significant in most lines are labeled even if they are not significant in a specific line. b, Genes from two-gene paralog families that were a hit displayed with their beta values. The paralogous genes for these screen hits are shown in parentheses. Each dot represents a cell line. c, Top paralog gene pairs identified from single gRNA CRISPR data. The data shown is the relative gene expression levels of these pairs derived from our ten screened uveal cell lines (top) and the 80 tumors in the TCGA uveal melanoma dataset (bottom). These data illustrate that in patient samples, the genes CDS2, RIC8A and SPTSSA are robustly expressed at levels much higher than their paralog gene partner. Also shown is an analogous expression pattern in our uveal melanoma models (Supplementary Table 3). The box shows the IQR; the line marks the median; whiskers extend to data within 1.5× IQR from Q1 and Q3. d, NNMD values for the whole-genome screens for each of the ten cell lines analyzed in comparison to Project Score screens.
Fig. 4
Fig. 4. Uveal melanoma-specific essential genes are involved in GPCR signaling and phosphoinositide signaling pathways.
a, Uveal melanoma-specific gene hits (log2(FC) > 1.80 and Padj < 0.01; two-tailed Mann–Whitney U test with Benjamini–Hochberg correction). Significantly differential essential genes for uveal melanoma cell lines were computed by comparing gene essentiality scores from our uveal melanoma screens to genome-wide sgRNA CRISPR screens from DepMap 22Q2 (Methods; Supplementary Table 11). Blue dots denote the top uveal-specific essential genes; green dots are genes less essential in uveal cell lines versus pan-cancer. b, Pathway enrichment analysis of the 76 uveal melanoma-specific genes using GO molecular function pathways. c, Dependency rank of top ten genes in uveal melanoma compared with pan-cancer cell lines. As above, pan-cancer data obtained from DepMap 22Q2 release. The analysis compared the 10 uveal lines to 982 pan-cancer cell lines. The box shows the IQR, the line marks the median, whiskers extend to data within 1.5× from Q1 and Q3, and points beyond are outliers. d, Validation of genome-wide sgRNA CRISPR screen hits with a competitive coculture assay (Methods). Cells were transduced with a lentivirus expressing an sgRNA and a BFP marker. BFP expression was measured by flow cytometry at baseline and on days 14 and 28. The proportion of surviving sgRNA-transduced cells compared with nontransduced cells is normalized to day 4. Two sgRNAs were tested against each gene, and an STG sgRNA was used as a control. Data represent three independent experiments performed in triplicate, with the mean and s.d. shown. Significance was calculated using a two-way ANOVA with Tukey’s multiple test correction. ****P < 0.0001, **P < 0.01, *P < 0.05 (exact P values are provided in the source data). Source data
Fig. 5
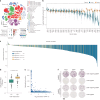
Fig. 5. Identification of CDS1/CDS2 synthetic lethality across multiple tumor types.
a, Analysis of single-cell sequencing data from the uveal melanoma microenvironment reveals strong expression of CDS2 in malignant cells. b, CDS1 and CDS2 gene expression in cancers based upon data generated by the TCGA Research Network and obtained from the UCSC Xena platform. Shown is the data range (mean − s.e. to the mean + s.e.) with points equaling the mean. c, Waterfall plot depicting CDS2 Chronos gene effect across 1013 pan-cancer cell lines from Project Achilles, DepMap 23Q4. Each column represents a cell line colored by CDS1 expression. d, Comparison of CDS2 essentiality in CDS1 low expressers (log2(TPM + 1) < 1) versus high expressers (log2(TPM + 1) ≥ 1) across 937 nonuveal melanoma cell lines analyzed in Broad DepMap (22Q2). A t test (two-sided, equal variance) was performed to compute significance. Box and whisker plots indicate the median and the 5th to 95th percentiles. Outliers as dots. e, Correlation between CDS1 methylation and expression. Methylation fraction represents a weighted average of the methylation ratios of all CpG sites within 1,000 bp from a gene’s transcriptional start site. The methylation ratio of each CpG site was determined by the number of reads where that CpG was methylated over the total number of reads covering that CpG. The weights of each CpG are calculated by the total number of reads covering that CpG overall and the total number of reads covering any CpG within 1,000 bp of the gene’s transcriptional start site. Data obtained from DepMap 23Q2 (ref. ). Each dot represents a cell line. f, Genetic rescue of CDS2 lethality with a CDS1 cDNA. OMM2.5 cells were transduced with either an sgRNA targeting CDS2 or a control sgRNA (STG). As indicated, cells were also transduced with the CDS1 cDNA and cultured for 14 days before staining with crystal violet. The data shown is representative of three biological replicates performed in triplicate. Each circle is a well of a six-well plate. Source data
Fig. 6
Fig. 6. Mechanistic insights into the effects of CDS2 loss.
a, Clonogenic assay showing the effects of CDS2 disruption at day 14 following the addition of Dox to Cas9-expressing cells that contain a Dox-inducible CDS2 or an STG control sgRNA (STG2). Data were collected from three independent biological replicates for each cell line (triangles, OMM2.5; circles, MP41). Representative plates are shown for one replicate of the OMM2.5 cell line. P values were calculated with Welsh’s two-tailed t test (without correction). Circles are a well of a six-well plate. b, Flow cytometry results from apoptosis assays at day 14 following CDS2 sgRNA induction with Dox, compared with induction of an STG sgRNA control. Data collected from three biological replicates. Data shown are mean and s.d. P values were calculated using a two-tailed t test. Wild-type cells are shown for comparison. c, Disruption of CDS2 following Dox treatment leads to a progressive reduction in the phosphoinositides PI and PIP and an increase in the precursor PA, compared with the DMSO control. Data are represented as mean ± s.e.m. from three independent MP41 clones and one OMM2.5 clone across three independent experiments. P values were calculated using a two-way ANOVA with Sidak’s correction with significant values shown. d, 4,4-Difluoro-1,3,5,7,8-pentamethyl-4-bora-3a,4a-diaza-s-indacene (BODIPY 493/503) staining (green) of lipid droplets in cells treated with Dox or DMSO for 14 days. DAPI-stained nuclei (blue). This experiment was performed twice independently. e, Schematic of the in vivo experiments performed in 28 female mice at 8 weeks of age (NOD-Prkdcscid-IL2rgTm1/Rj background). After implantation of tumor cells, mice were blindly randomized into two groups (Methods) with the switch to a Dox-containing diet occurring on day 24 (arrow). Data shown are mean ± s.d. Significance was determined using a mixed-effects model with the Geisser–Greenhouse correction. f, Schematic of the role of CDS1/CDS2 in phosphoinositide de novo synthesis and recycling. Source data
Extended Data Fig. 1
Extended Data Fig. 1. Effect of CDS2 loss on colony formation and CDS2 protein expression.
Top: clonogenic assay with clones produced from uveal melanoma cells containing a doxycycline-inducible CDS2 sgRNA construct. These data were collected from three independent experiments using different cell passages. Middle; replicate clonogenic assays using polyclonal cell lines. R refers to independent biological replicates/the experiment was performed three times independently. STG2 refers to safe-targeting sgRNA 2 (Supplementary Table 17). Cells were seeded in six-well plates for these experiments. Colony formation after 14 days of treatment with 0.1 µg ml−1 doxycycline. Cells were fixed and stained with 0.1% crystal violet. Bottom: Western blots are shown which illustrate CDS2 protein depletion upon doxycycline treatment. Multiple clones of MP41 are shown (A, D, E) and one OMM2.5 clone. These blots were performed once. Days indicates the days after the addition of Dox. Vinculin was used as a loading control. Dox, doxycycline; DMSO, dimethyl sulfoxide. The higher band for CDS2 seen in MP41 has been reported previously. Source data
Extended Data Fig. 2
Extended Data Fig. 2. Volcano plots for mass-spectrometry analysis following disruption of CDS2.
Top volcano plots showing depletion of CDS2 and other proteins in MP41 and OMM2.5 cells. These data represent analysis of three independent biological replicates (Methods). The Venn diagrams indicate the number of genes up- or downregulated in each model after Dox treatment (Supplementary Table 12). Bottom: significantly altered pathways. Proteins associated with selected enriched Gene Ontology (GO) terms are highlighted on the plots. Data visualization was performed using the Plotly package in Python. The differential expression was assessed using a paired two-sided t-test. Unadjusted P values < 0.05 and log2(FC) > 0.5 were considered as denoting a significant difference. Bottom right shows 1D enrichment. 1D enrichment analysis was performed using the Perseus software, which applies a two-tailed t-test with Benjamini-Hochberg (BH) correction. This method has been outlined previously.
Extended Data Fig. 3
Extended Data Fig. 3. Effect of CDS2 loss on PA and PIPn synthesis.
The effect of CDS2 loss following treatment with 0.1 µg ml−1 of doxycycline for 7 days or the equivalent volume of DMSO (vehicle) on the synthesis of the major acyl chain species of PA and PI, PIP and PIP2 in MP41 and OMM2.5 cells. Values were calibrated to 34:1 PC and normalized to the mean DMSO values obtained at days 3, 5 and 7. Data are represented as mean ± SEM (n = 3) from three independent MP41 clones and one OMM2.5 clone across 3 independent experiments. Significance determined from analysis of viable and combined apoptotic/dead cell populations is shown. A t-test (two-sided) was used and exact P values < 0.05 are shown. Dox, doxycycline; DMSO, dimethyl sulfoxide; PA, phosphatidic acid; PI, phosphatidylinositol; PIP, phosphatidylinositol monophosphate; PIP2, phosphatidylinositol bisphosphate; PIPn, phosphoinositide. Source data
Extended Data Fig. 4
Extended Data Fig. 4. CDS2 essentiality across DepMap correlates with GPCR signaling.
a, GPCR pathways, involving receptor-ligand pairs in either signal transduction or metabolism processes (red bars; ref. ). b, These GPCR pathways are characterized by a significantly different cumulative distribution function (CDF) of correlation values with respect to other pathways (Kolgomorov-Smirnoff (KS) P value = 2.2 × 10−16), and specifically at negative correlations (KS P value < 0.001). This suggests activated GPCR signaling correlates with an increase in CDS2 essentiality. c, CDS2 Chronos/GPCR pathway most negative correlations. The correlation shown is a Spearman coefficient. As noted above, we found that multiple pathways involved in GPCR signal transduction are more frequent at negative correlation values, suggesting that higher CDS2 essentiality (given by more negative Chronos score) is more common in those cancer cell lines displaying up-regulation of GPCR signal transduction pathways (given by higher normalized enrichment scores).

References

    1. Khoja, L. et al. Meta-analysis in metastatic uveal melanoma to determine progression free and overall survival benchmarks: an international rare cancers initiative (IRCI) ocular melanoma study. Ann. Oncol.30, 1370–1380 (2019). - PubMed
    1. Rantala, E. S., Hernberg, M. & Kivela, T. T. Overall survival after treatment for metastatic uveal melanoma: a systematic review and meta-analysis. Melanoma Res.29, 561–568 (2019). - PMC - PubMed
    1. Nathan, P. et al. Overall survival benefit with tebentafusp in metastatic uveal melanoma. N. Engl. J. Med.385, 1196–1206 (2021). - PubMed
    1. Carvajal, R. D. et al. Clinical and molecular response to tebentafusp in previously treated patients with metastatic uveal melanoma: a phase 2 trial. Nat. Med.28, 2364–2373 (2022). - PMC - PubMed
    1. Shoushtari, A. N. et al. A phase Ib study of sotrastaurin, a PKC inhibitor, and alpelisib, a PI3Kα inhibitor, in patients with metastatic uveal melanoma. Cancers (Basel)13, 5504 (2021). - PMC - PubMed

LinkOut - more resources